SpaceX Erases Its IPO Pop 📉 The Chart Report

Chart of the Day
🏆 Today's Chart of the Day was shared by Shake Pryzby.
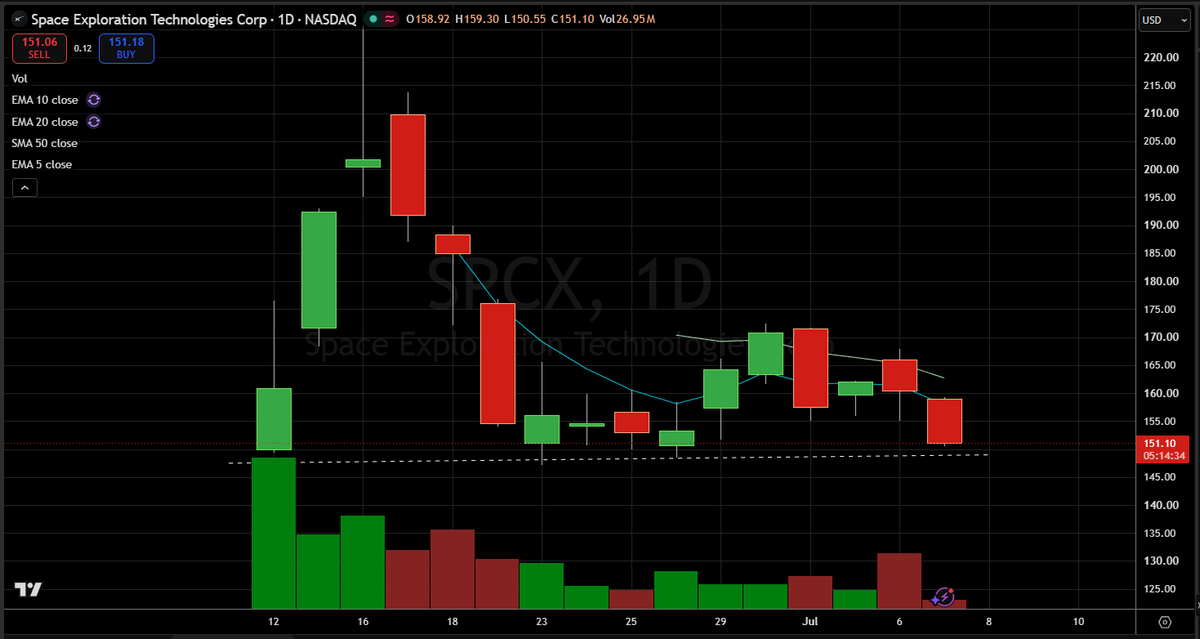
SpaceX has completed the infamous IPO round trip, surrendering all of its post opening-day gains following a historic market debut.
The stock currently sits in a 33% drawdown from its $225 peak, with the technical damage accelerating after SPCX broke below its IPO-day VWAP on June 22, signaling that the average buyer from its debut had fallen underwater.
Now, every investor who bought the IPO is sitting on a loss after the stock closed at its lowest level since going public, which ironically happened to be on the same day it officially joined the Nasdaq 100.
The Takeaway: The SpaceX euphoria has officially faded, with the stock closing at new record lows.
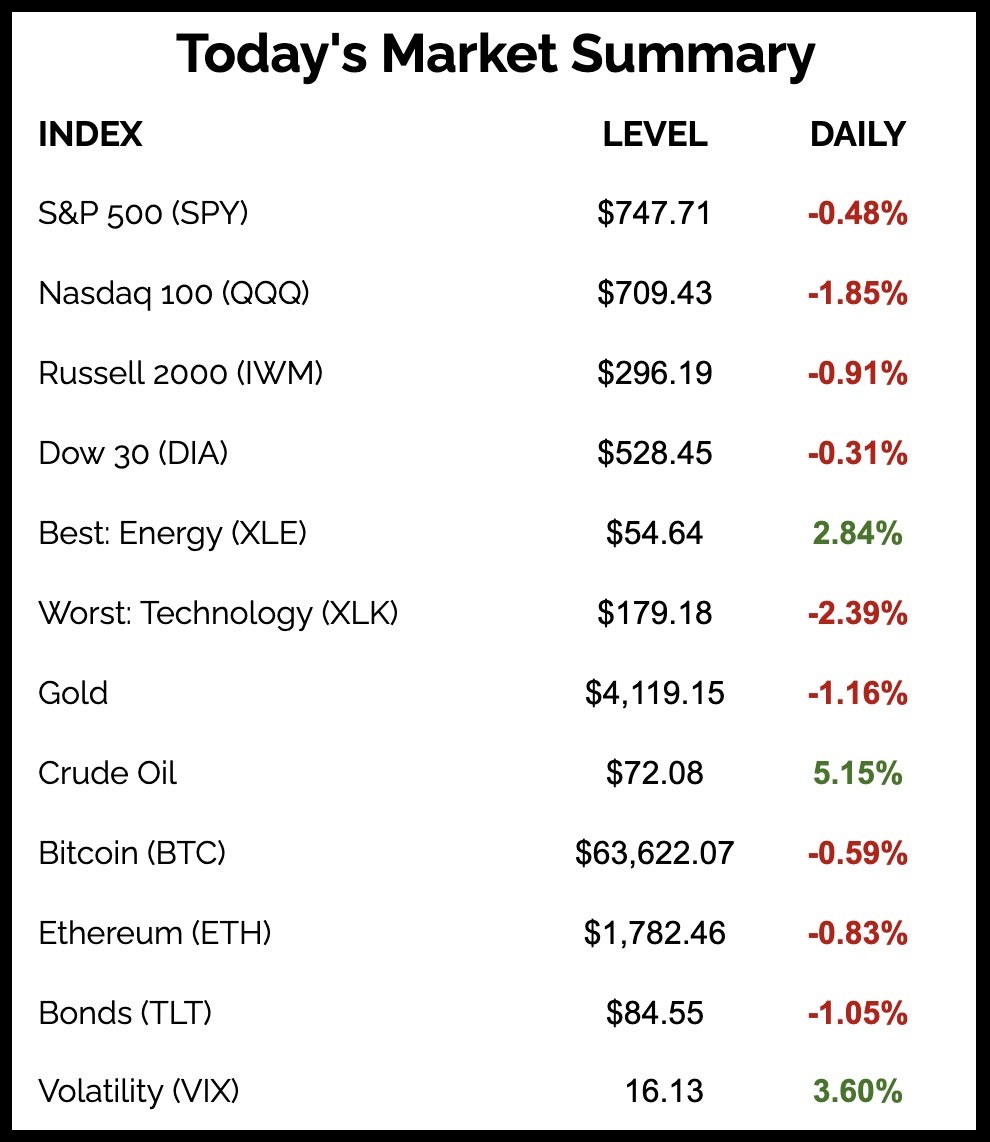
More Great Charts
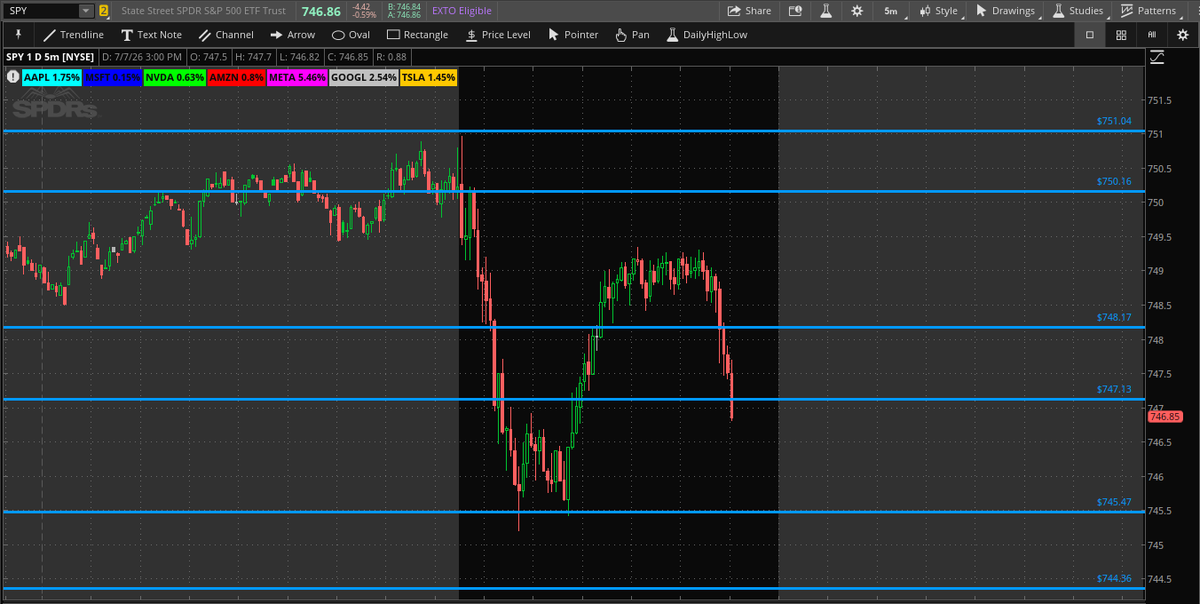
The S&P 500 rallied more than half a percent off its intraday lows before reversing lower to finish the session down 0.48%.
View the entire tweet from Quant Data.
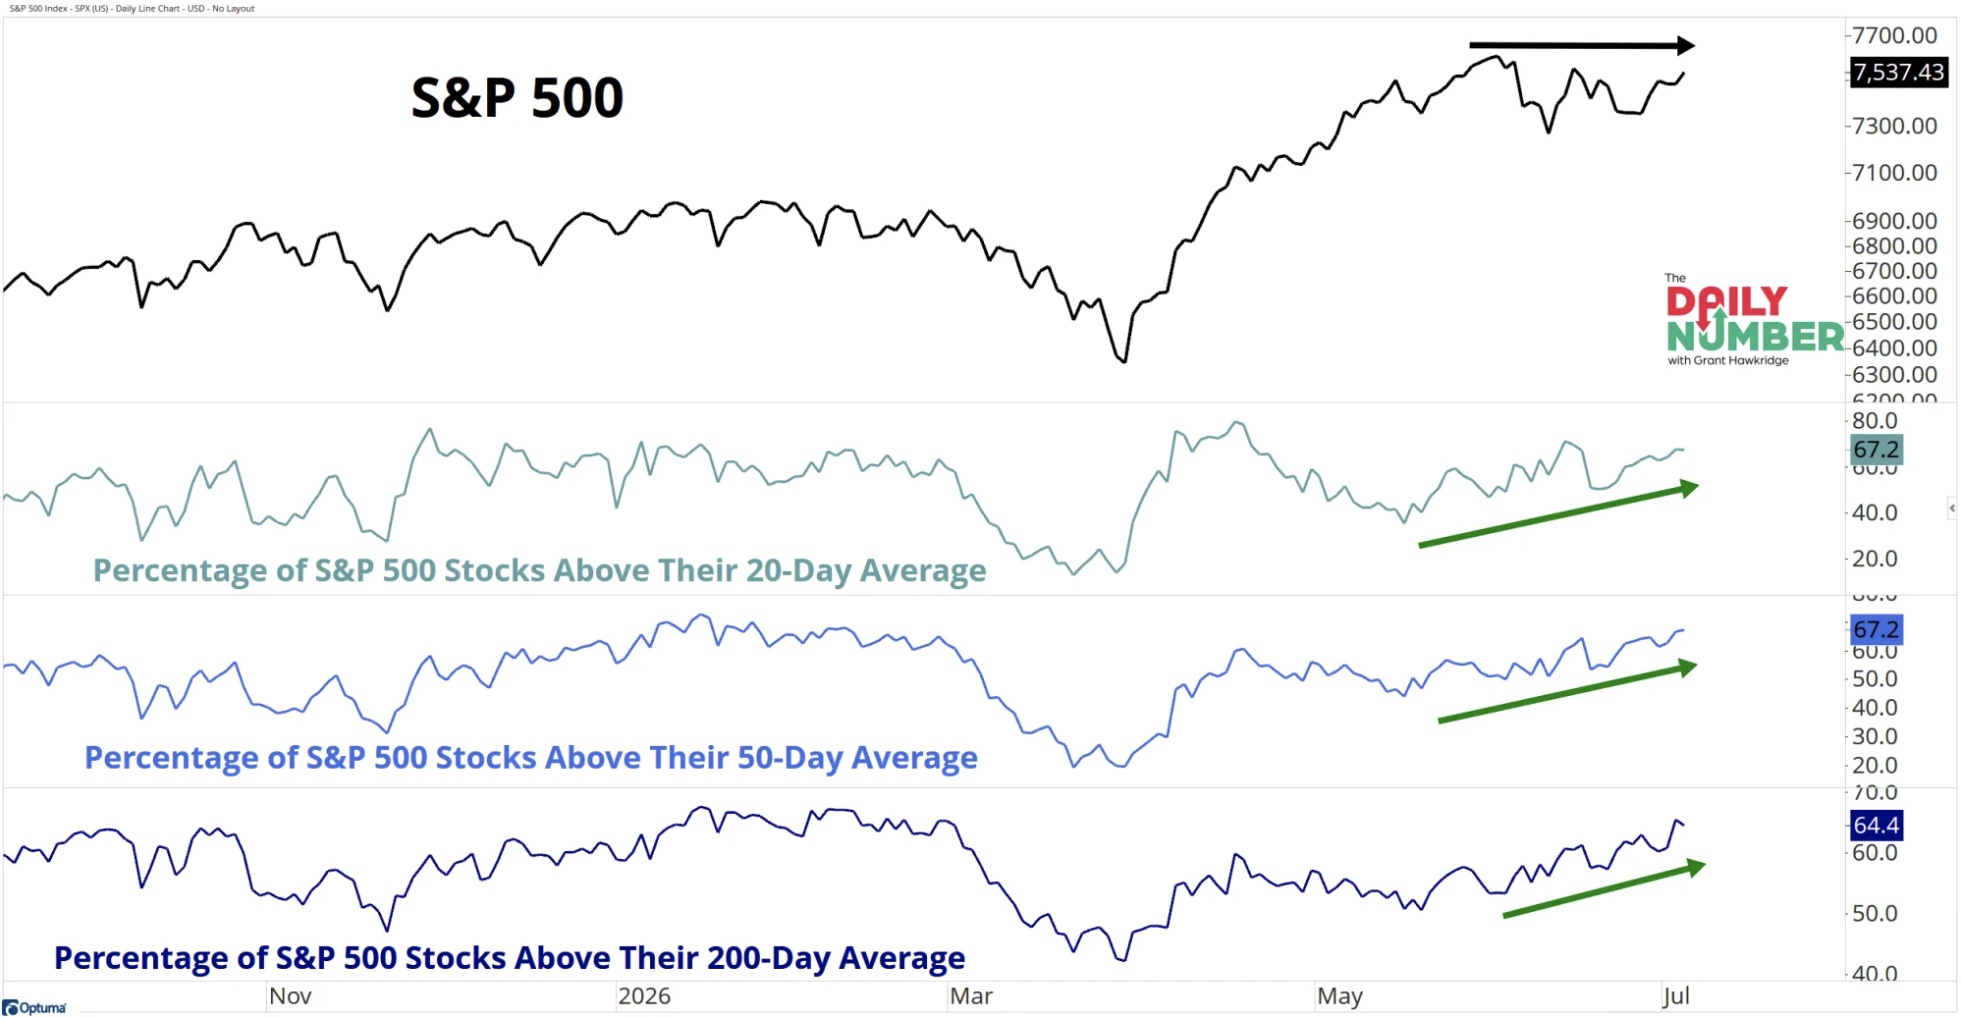
While the S&P 500 has made little progress over the past month, market participation continues to improve beneath the surface.
Read the full analysis from Grant Hawkridge.
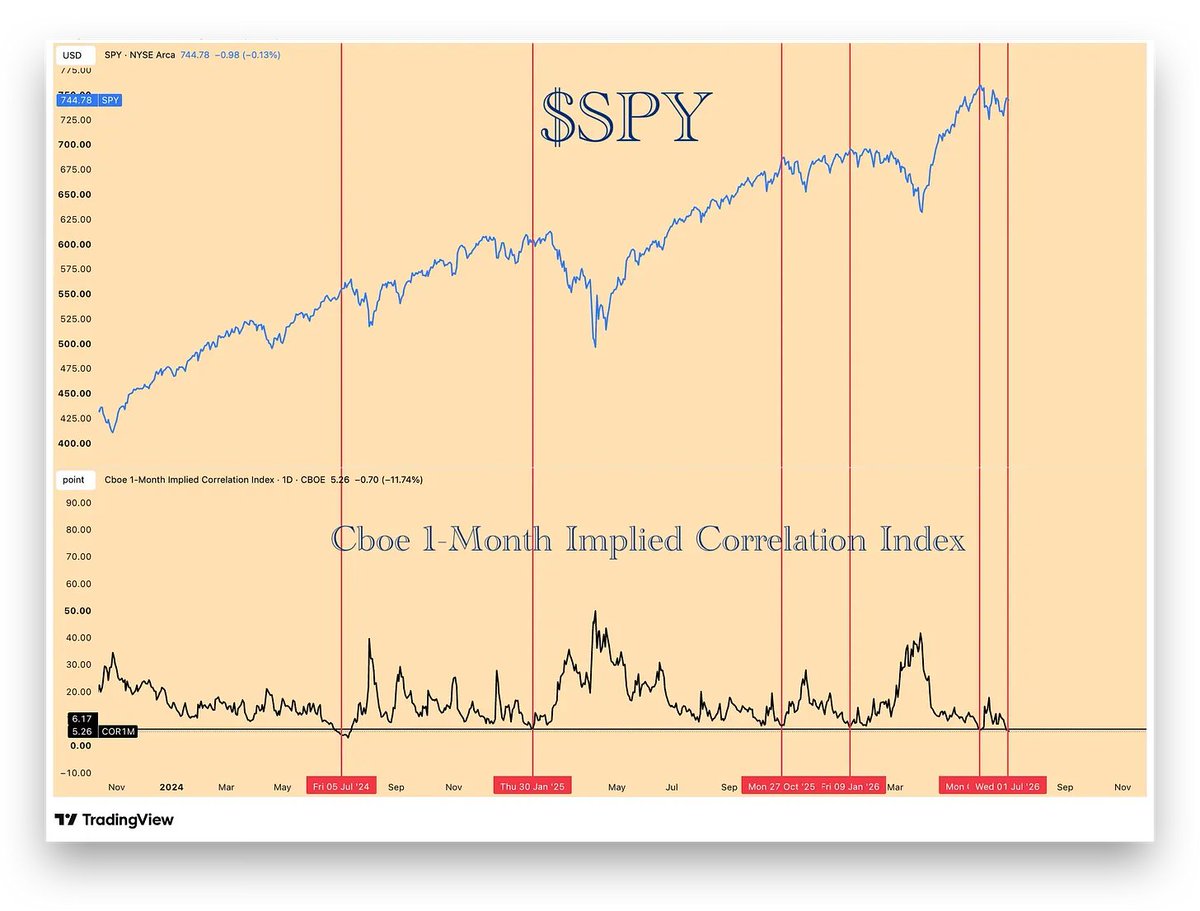
The 1-Month Implied Correlation Index has fallen to extremely low levels, a reading that has often preceded sharp pullbacks in the S&P 500.
See the whole tweet from Cycle Investment Strategy.
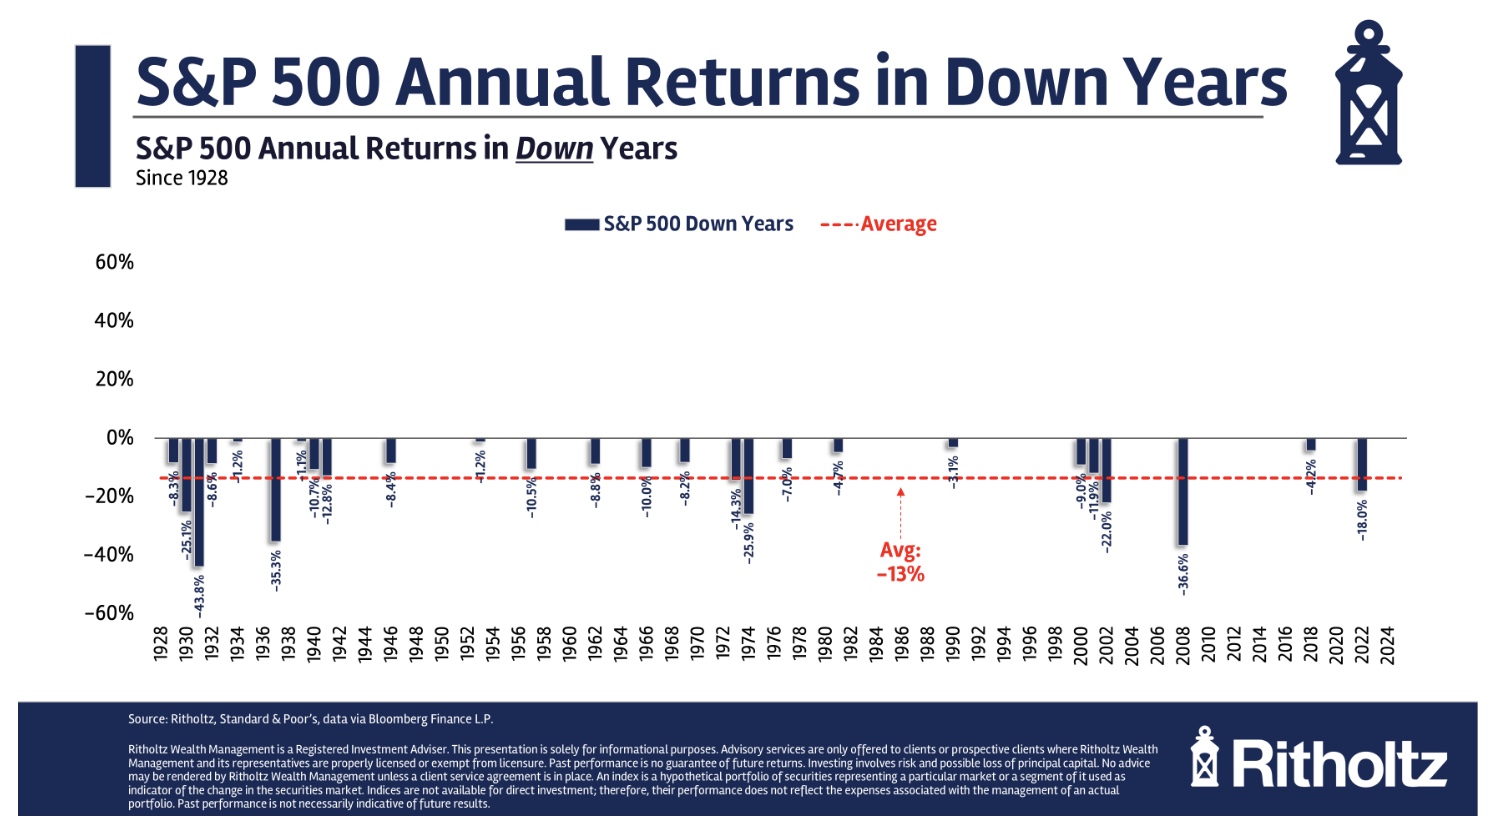
Down years for the S&P 500 have been rare since the cyclical lows following the Great Financial Crisis.
Check out the latest article from Ben Carlson.
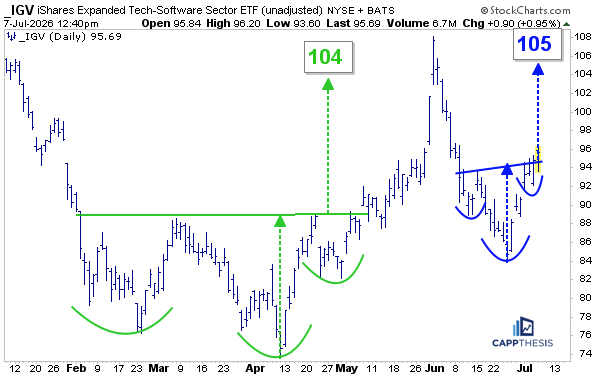
The Software ETF is nearing a breakout from an inverse head-and-shoulders pattern, implying a measured move target of $105.
Read the complete research from Frank Cappelleri.
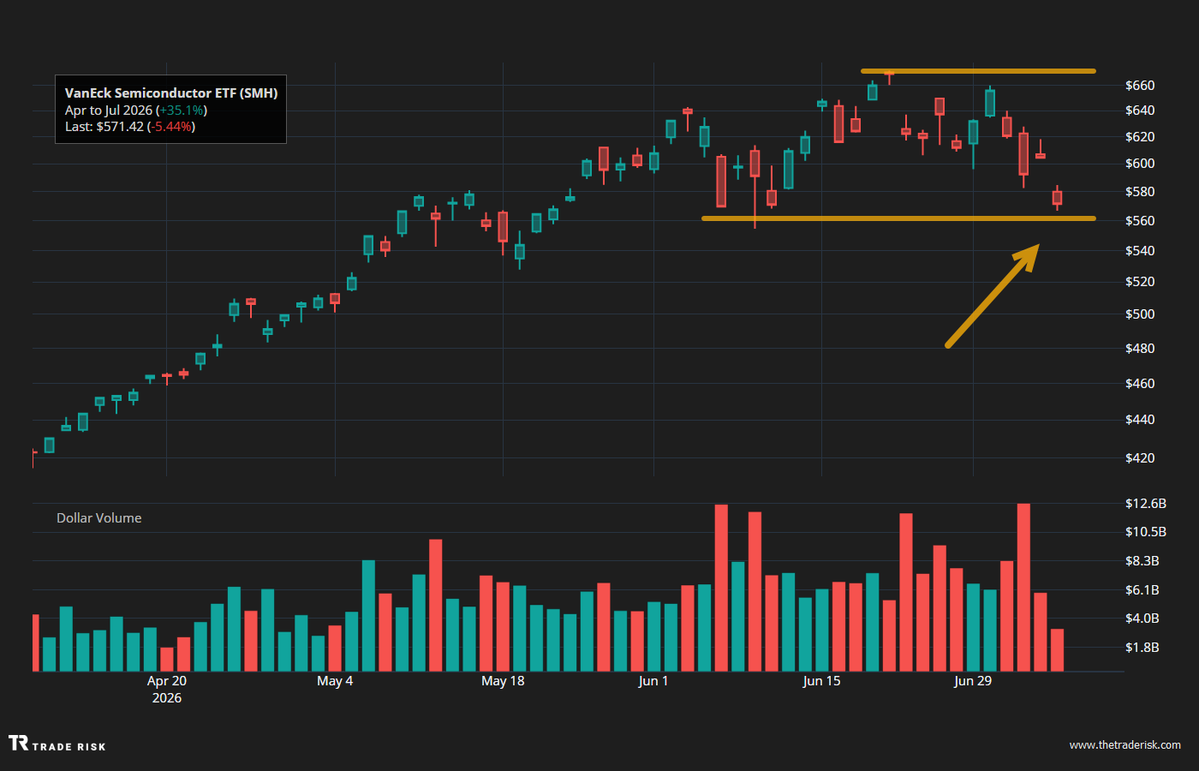
The Semiconductor ETF continues to hold last month's pivot lows.
Examine the full tweet from Evan Medeiros.
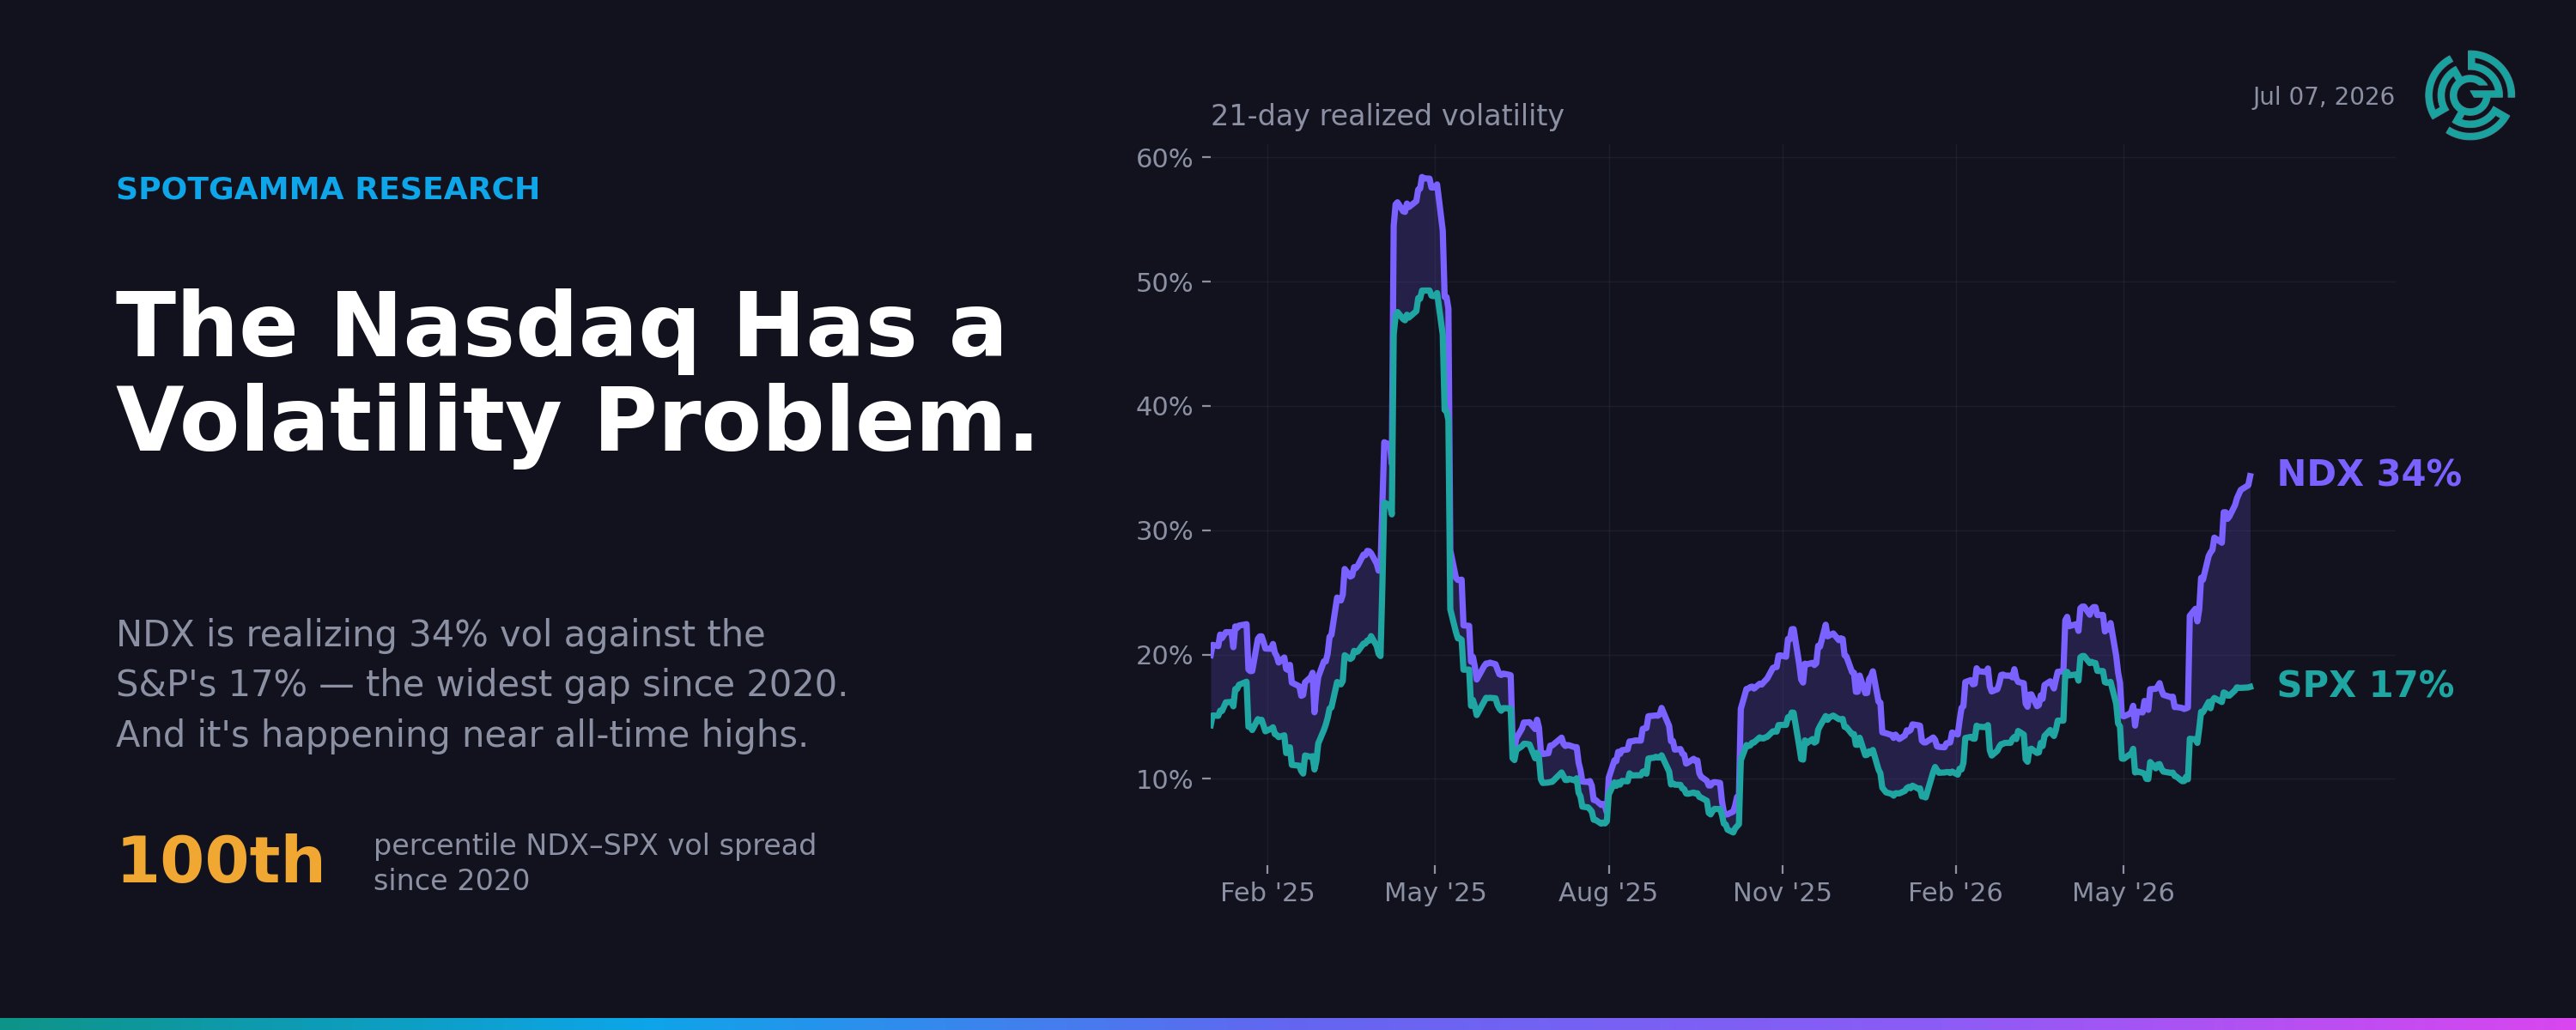
Nasdaq-100 implied volatility is pricing in significantly more movement than the S&P 500, marking the widest gap since 2010.
View the entire post from Spot Gamma.
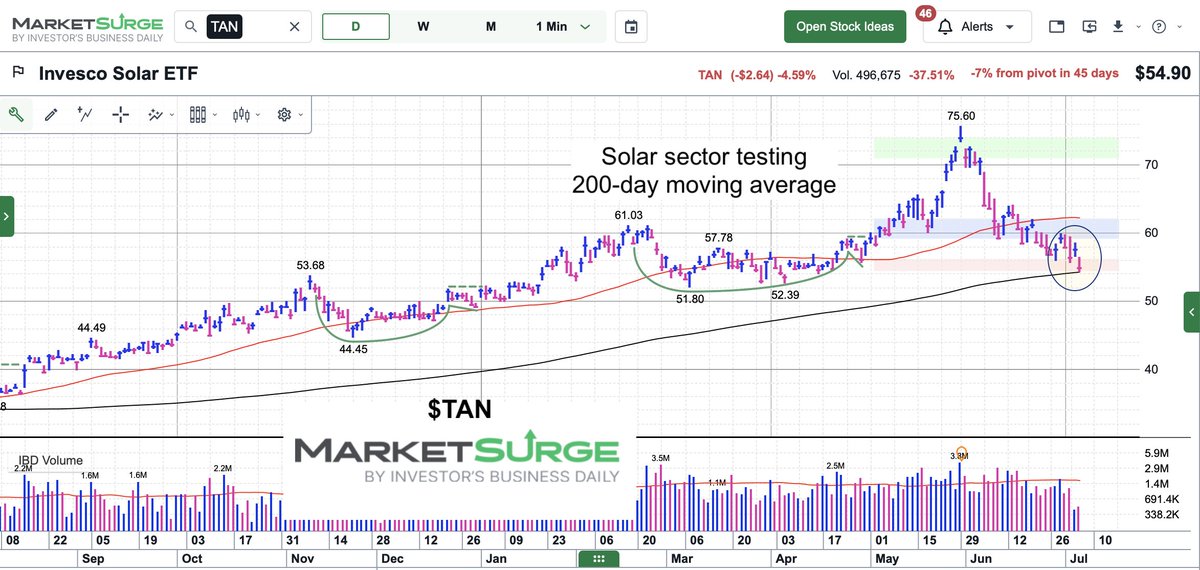
The Solar ETF is testing its long-term 200-day moving average.
See the whole tweet from SeeItMarket.
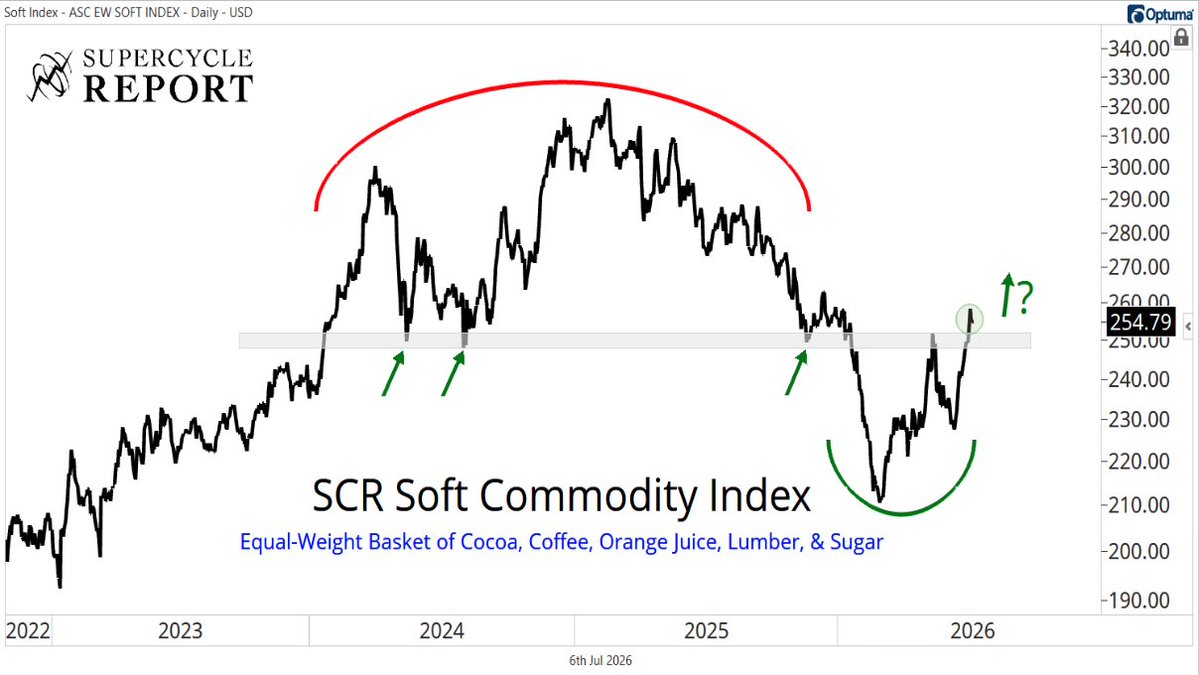
Soft Commodities appear to be completing a failed breakdown at a key level of former support.
Check out the complete post from Jason Perz.
The Chart Report curates best-in-class technical analysis from across the web.
If you’d like to share a chart or just say hello, email us at [email protected]