This Is the Bear Case for Stocks 📉 The Chart Report

Chart of the Day
🏆 Today's Chart of the Day was shared by Rachel Dashiell.
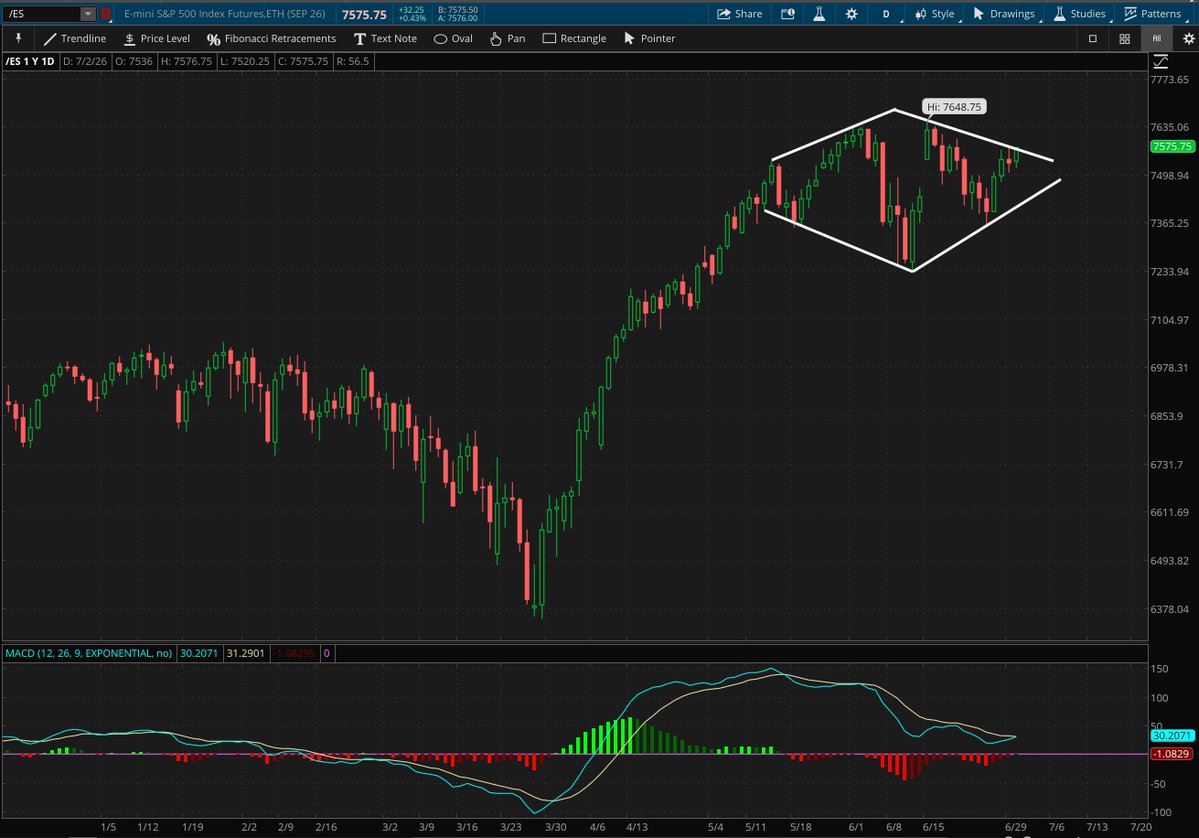
The S&P 500 has formed a rare diamond top, a pattern that boasts one of the highest success rates in technical analysis.
If the pattern resolves to the downside, the measured move projects a target near 7,000, which also aligns with the prior highs established in Q1 of this year.
While the MACD is nearing a potential bullish crossover shown in the bottom pane, an identical signal failed just last month, preceding a sharp -5% decline in just five trading days.
The Takeaway: The S&P 500 is flirting with one of technical analysis' rarest reversal patterns.
More Great Charts
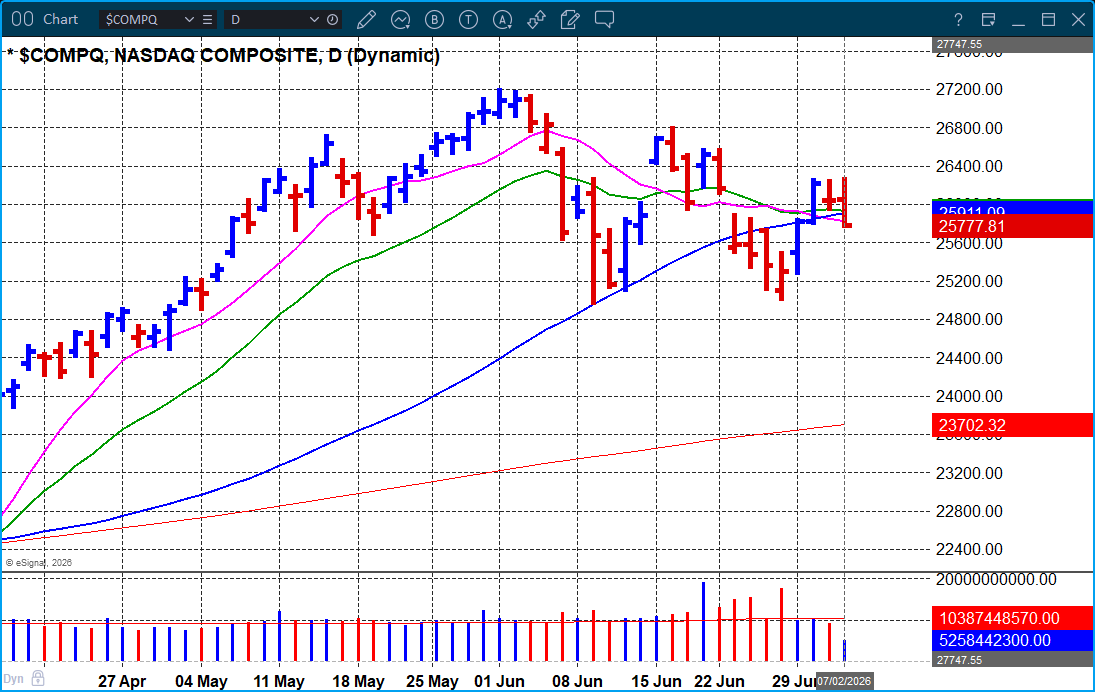
The Nasdaq Composite closed below its 50-day moving average.
View the full post from Gil Morales.
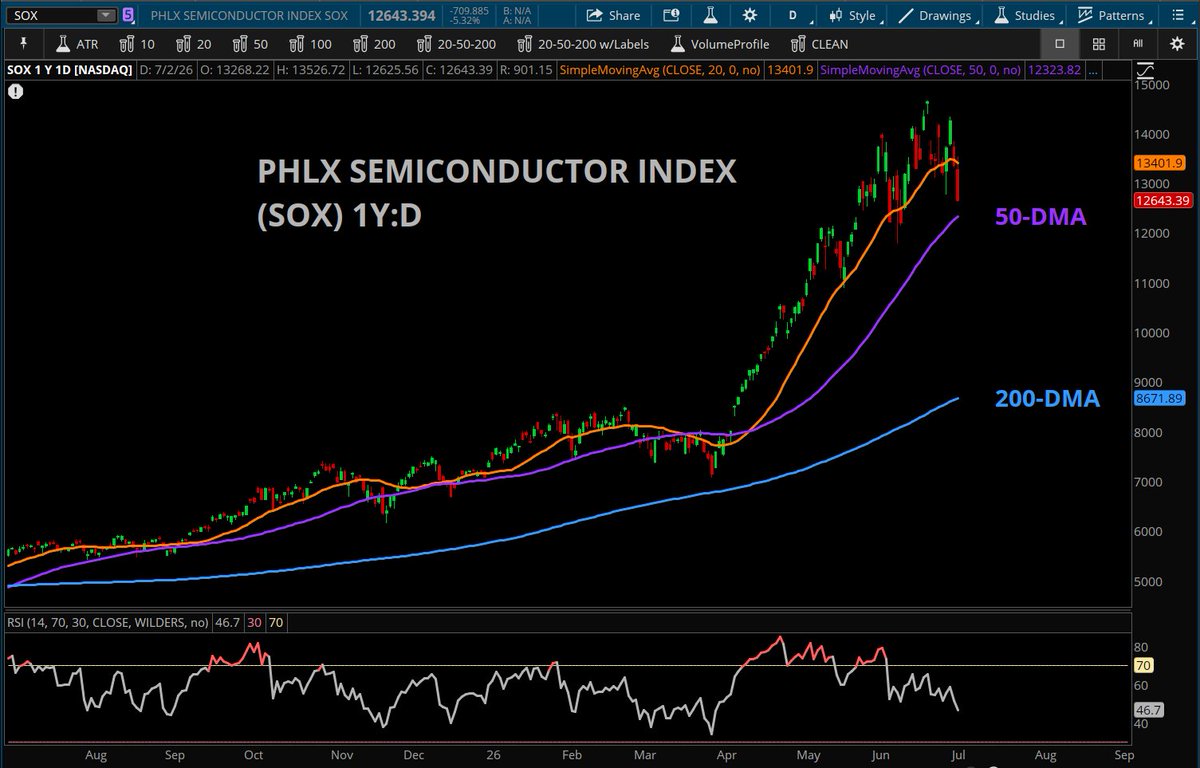
The PHLX Semiconductor Index slid over -6% today following a multi-month bearish momentum divergence.
See the entire tweet from Kevin Horner.
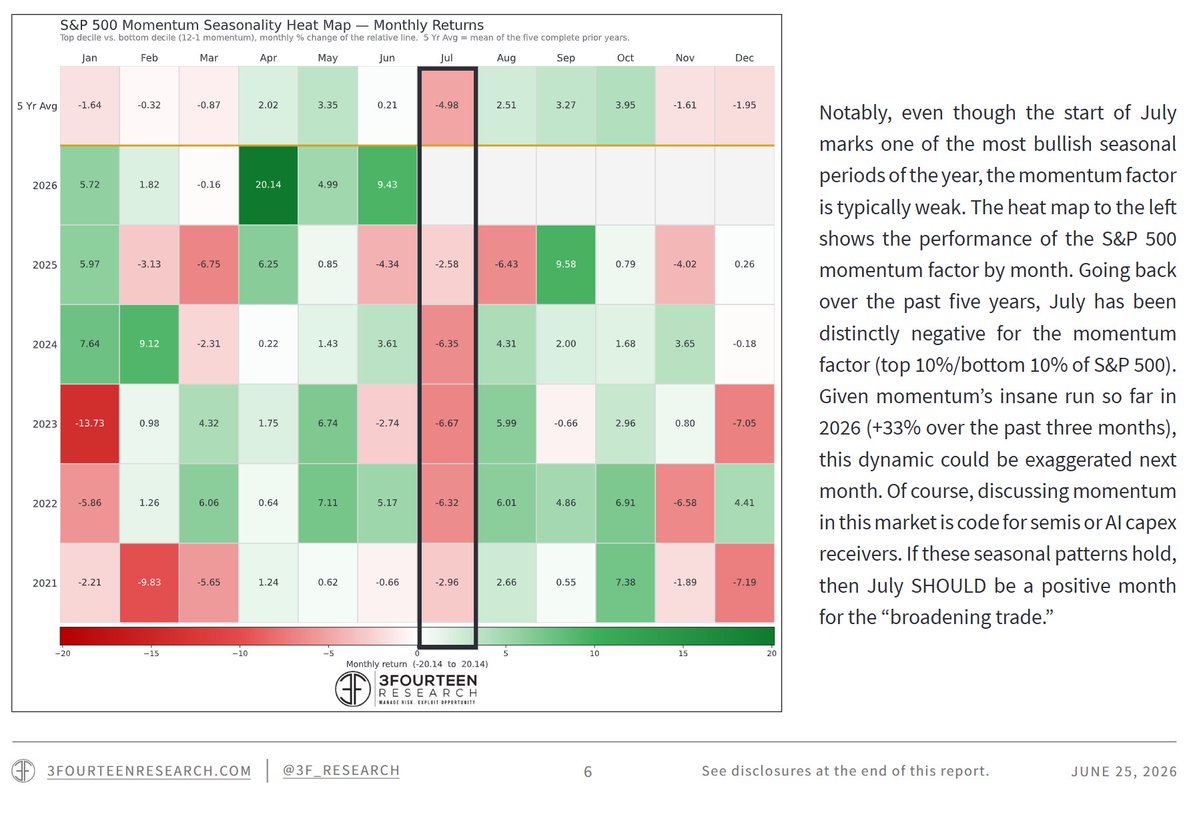
While July has historically been a bullish month for the S&P 500, it has been the weakest month for the momentum factor over the past five years.
Examine the complete post from Warren Pies.
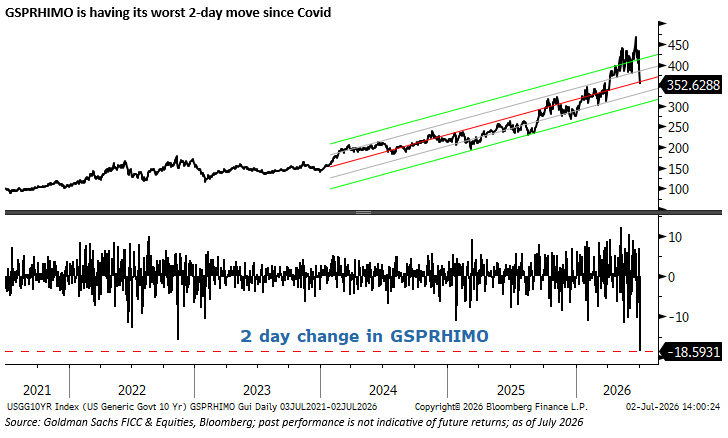
Goldman Sachs' High Beta Momentum Index posted its worst two-day decline since COVID.
Check out the whole tweet from Negligible Capital.
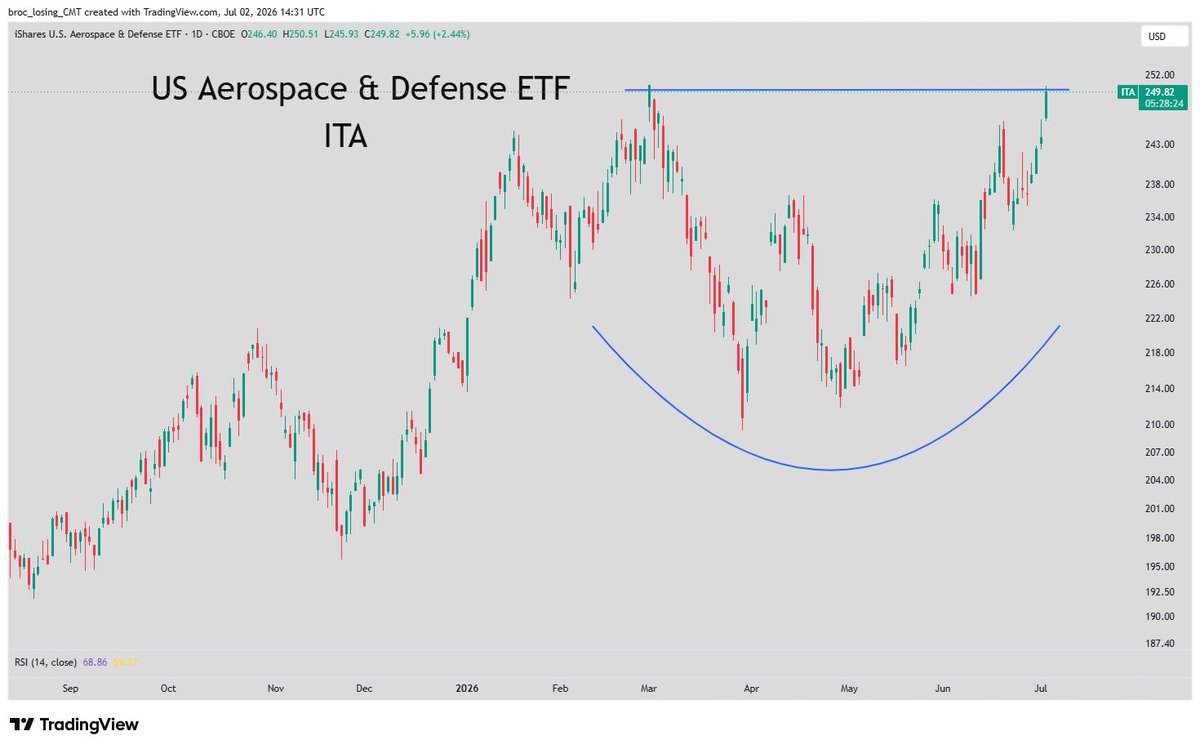
The Aerospace & Defense ETF has rallied back to its March highs.
View the full post from Broc Losing.
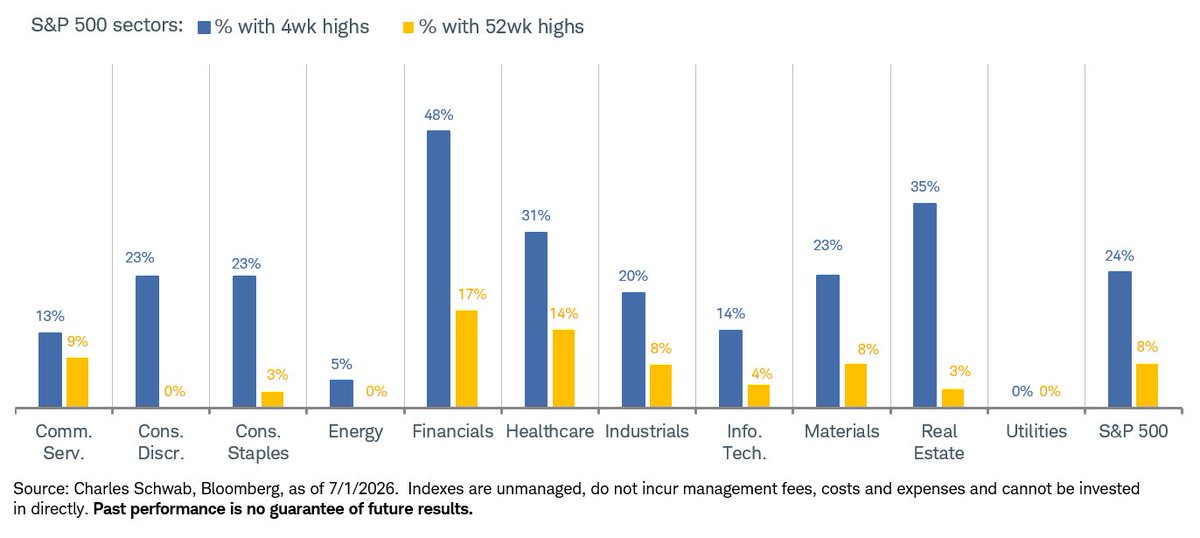
Financials and Healthcare currently have the highest percentage of stocks trading at new 52-week highs.
See the entire tweet from Liz Sonders.
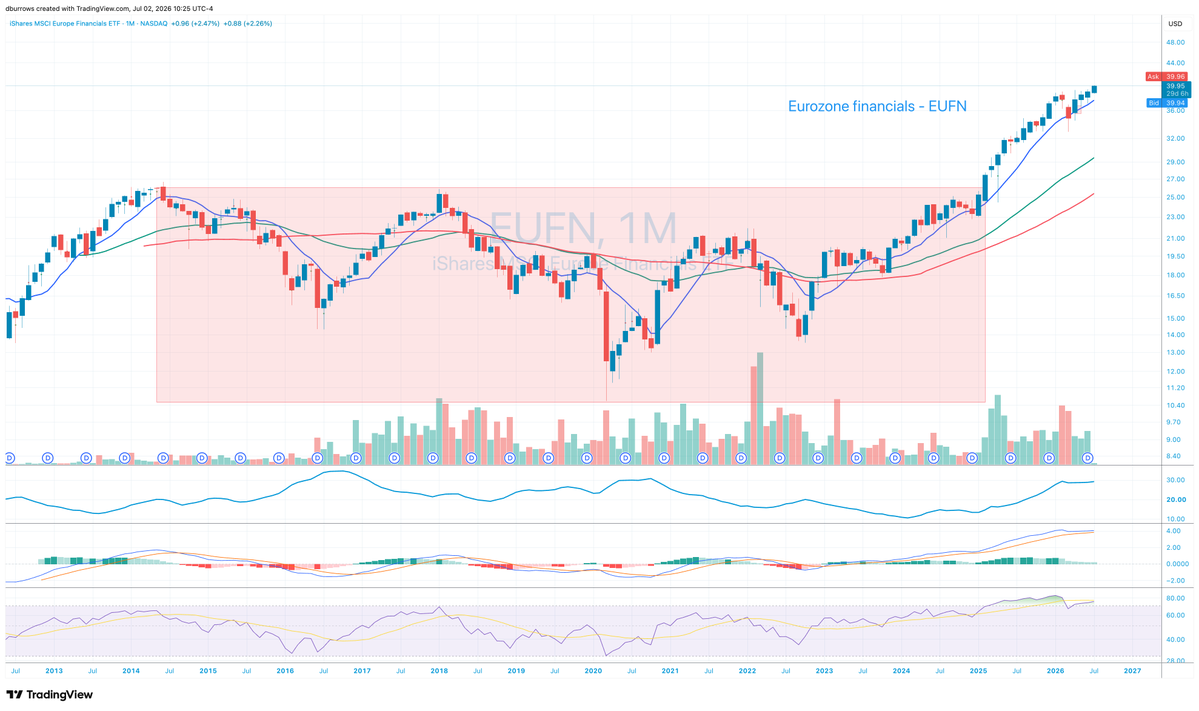
European Financials closed at new all-time highs.
Examine the complete post from David Burrows.
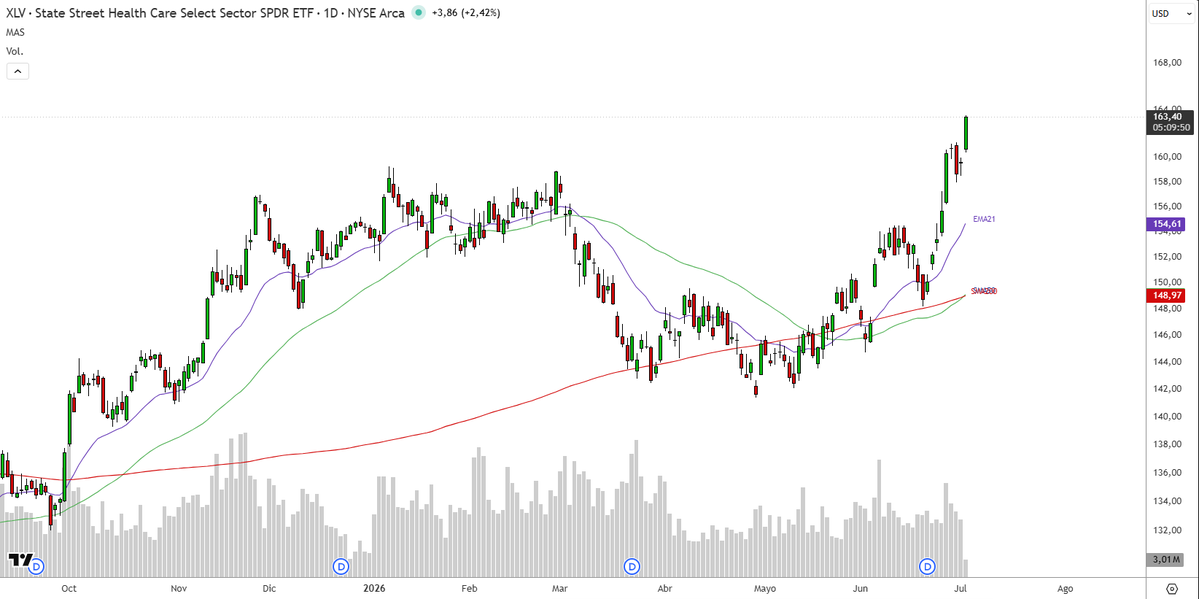
The Healthcare Sector ETF made new record highs on a strong breakout.
View the whole tweet from Gonza Sanchez.
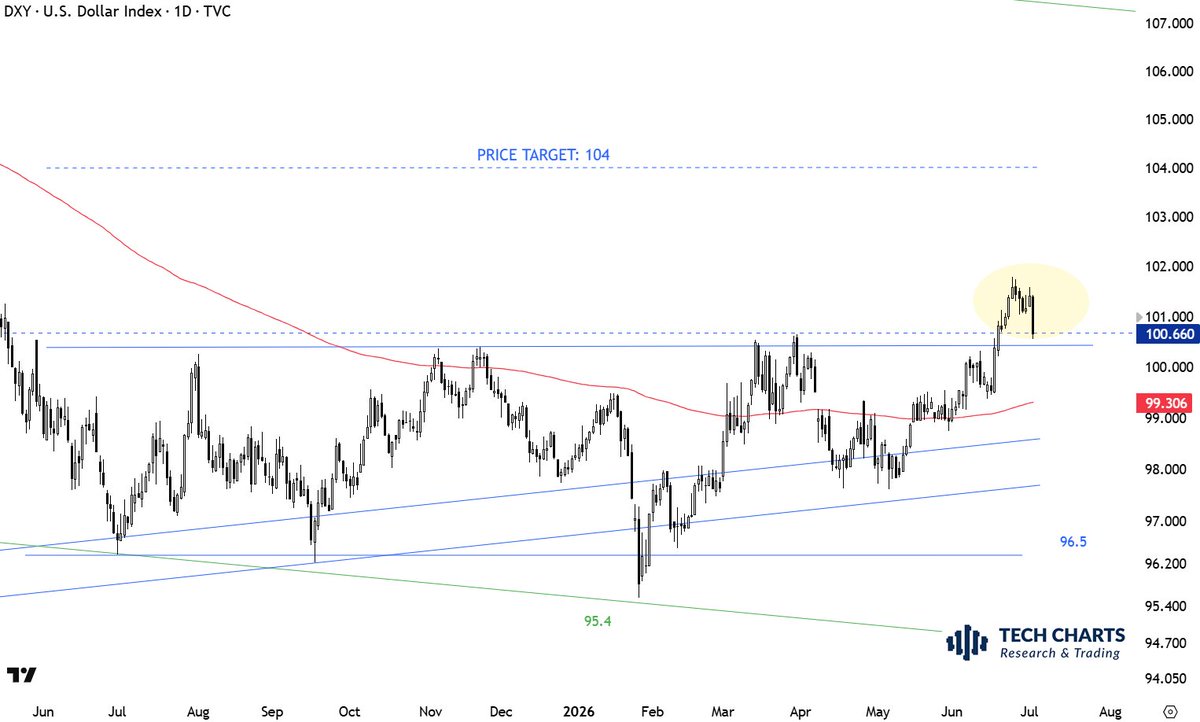
The U.S. Dollar Index has pulled back to the psychological $100 level.
Check out the entire post from Aksel Kibar.
The Chart Report curates best-in-class technical analysis from across the web.
If you’d like to share a chart or just say hello, email us at [email protected]