The Strongest Corner of Software 📈 The Chart Report

Chart of the Day
🏆 Today's Chart of the Day was shared by Christian Fromhertz.
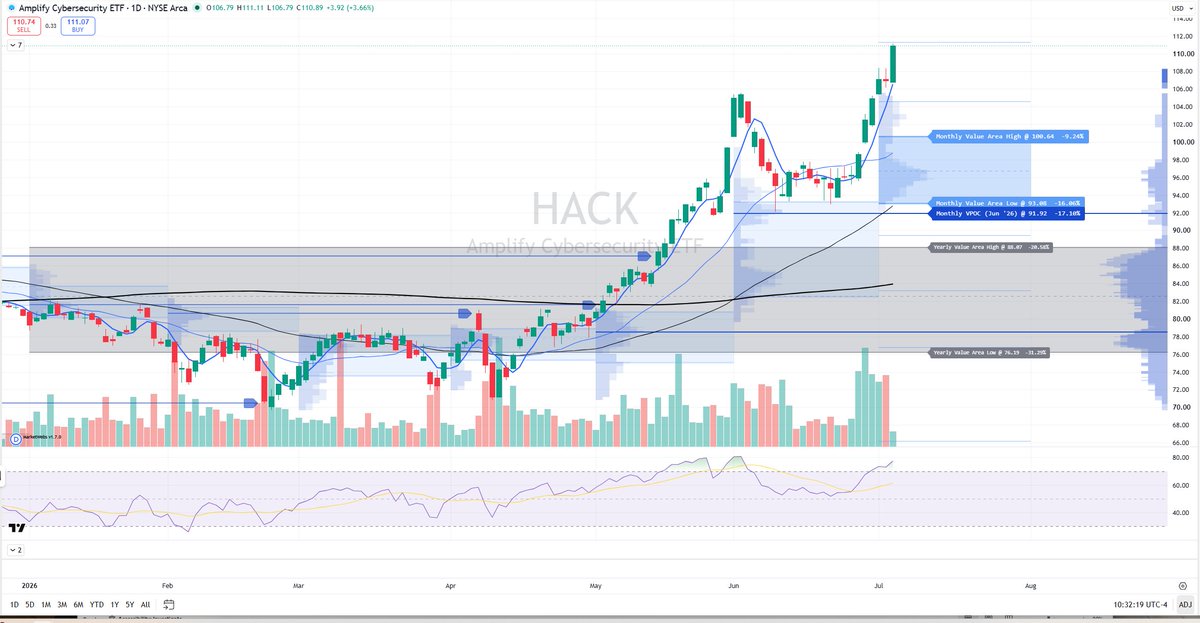
The Amplify Cybersecurity ETF (HACK) closed at a new all-time highs today following a multi-week consolidation after its best seven-week rally on record.
Cybersecurity stocks are also making new decade highs relative to software while notably remaining near decade lows versus the broader technology sector.
With software enduring its third-largest drawdown relative to the S&P 500 in history, today's move in HACK reinforces the view that cybersecurity remains the industry's clear leadership group.
The Takeaway: Cybersecurity stocks continue to separate themselves from the rest of the software industry.
More Great Charts
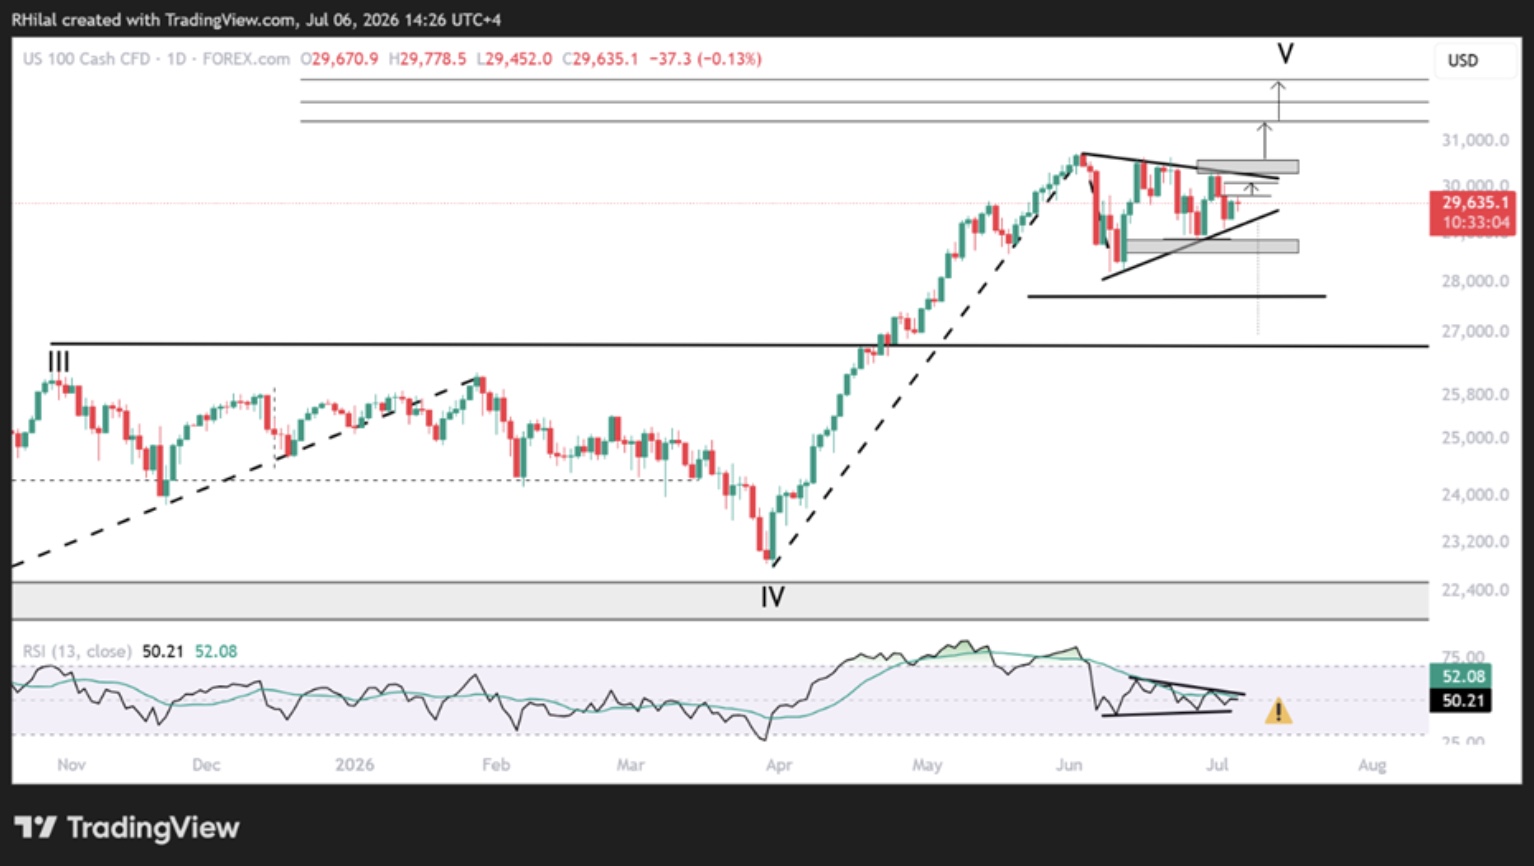
The Nasdaq is showing a narrowing consolidation from its June high, while RSI sits near the neutral 50 level.
Check out the full analysis from Razan Hilal.
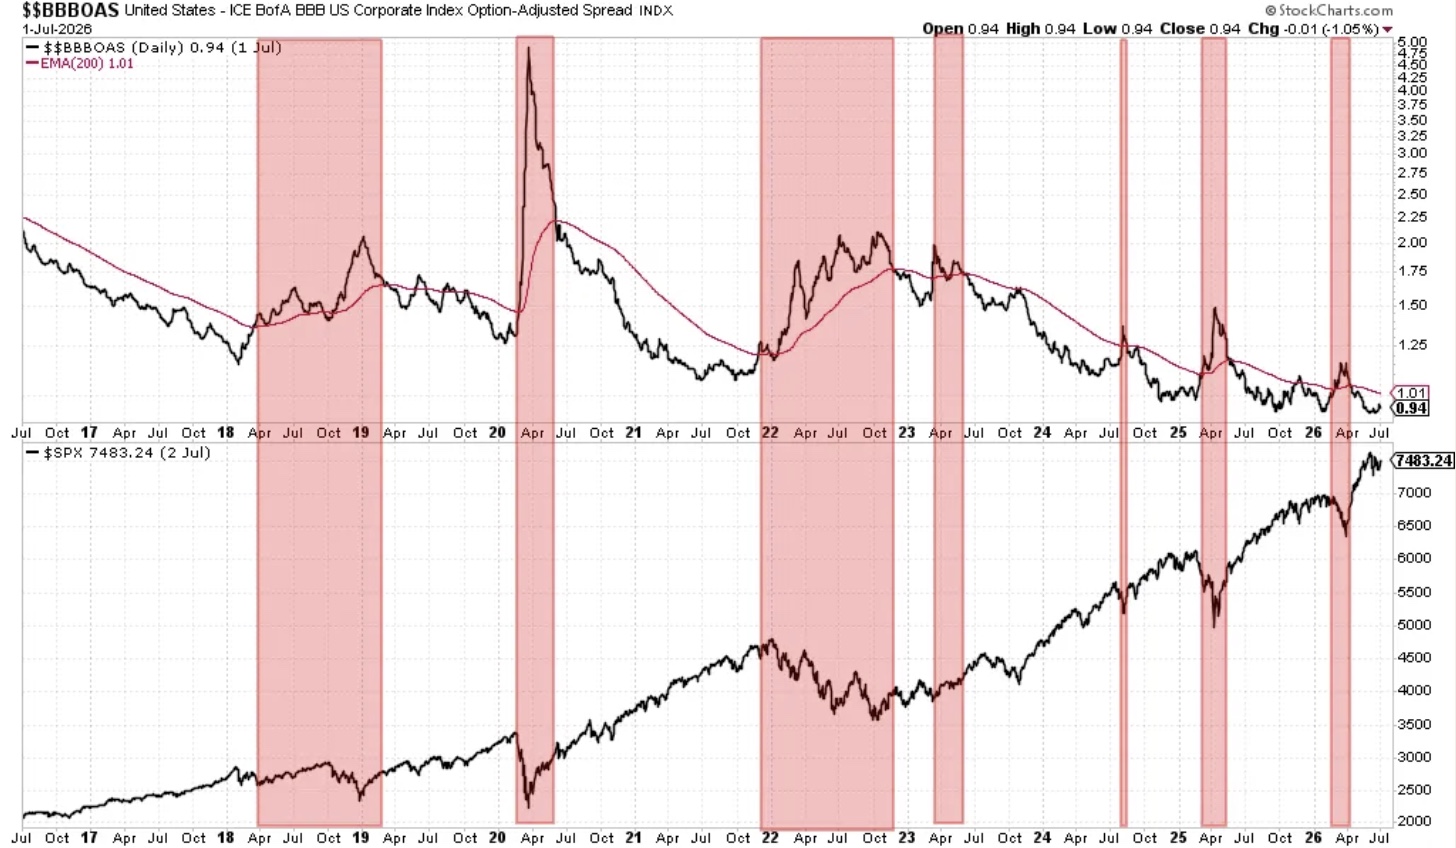
The spread on BBB-rated investment-grade corporate debt has ticked higher but remains below its 200-day EMA, indicating credit markets are not signaling meaningful stress.
Explore the entire article from Rotational Investing.
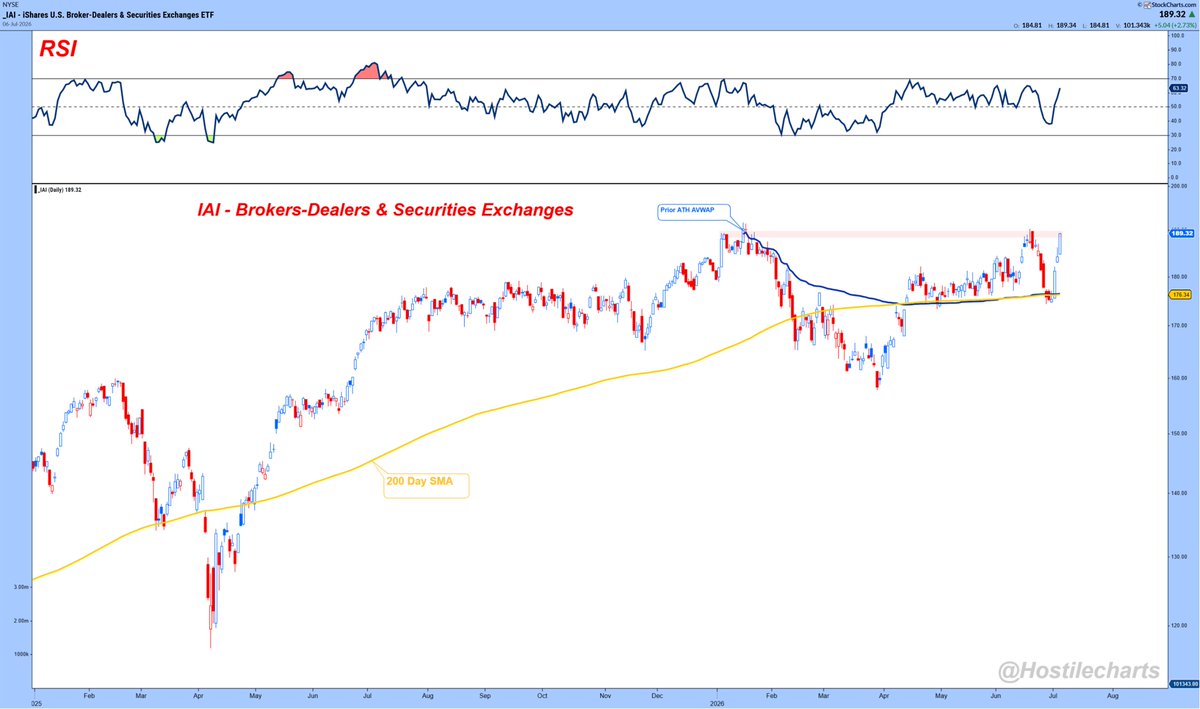
The Broker-Dealers & Securities Exchanges ETF (IAI) has rallied back into its prior highs.
View the whole post from Larry Thompson.
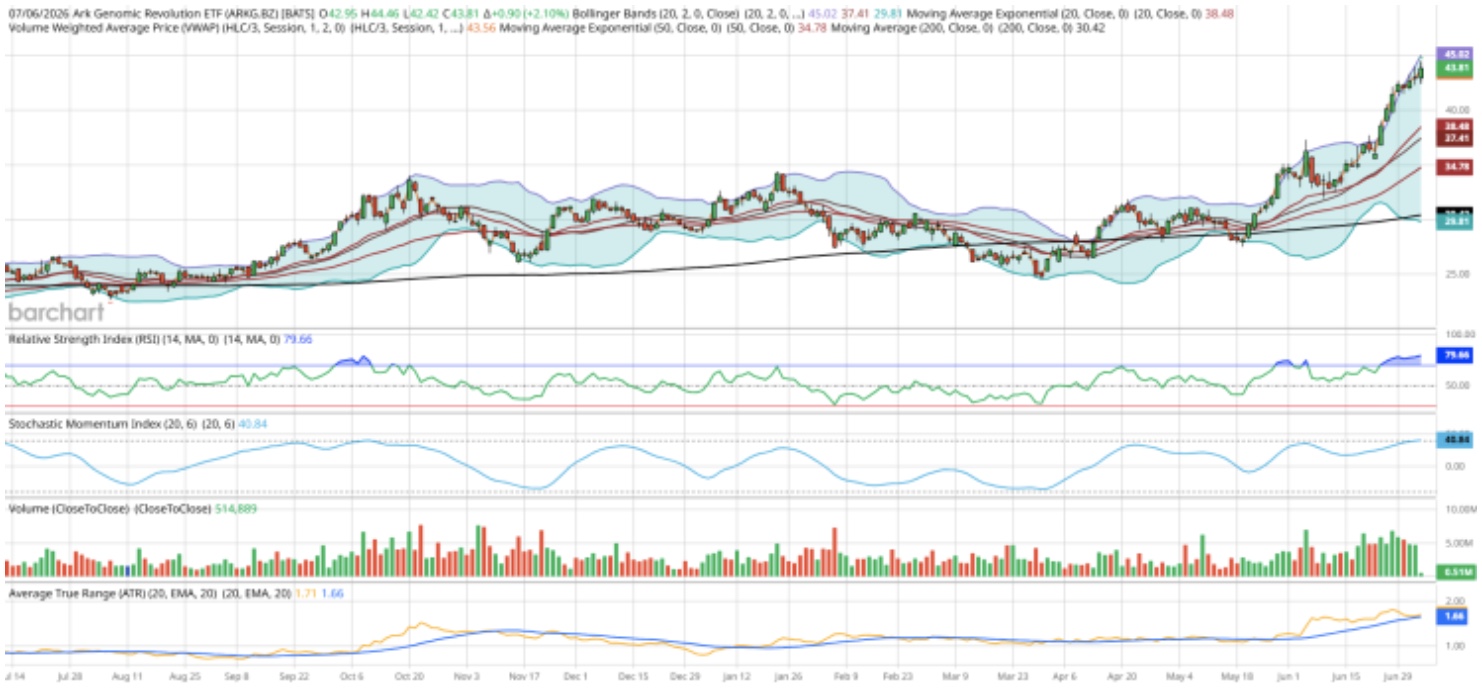
The ARK Genomic Revolution ETF (ARKG) is making new 52-week highs and has rallied more than 60% from its three-month low.
Read the complete article from John Salama.
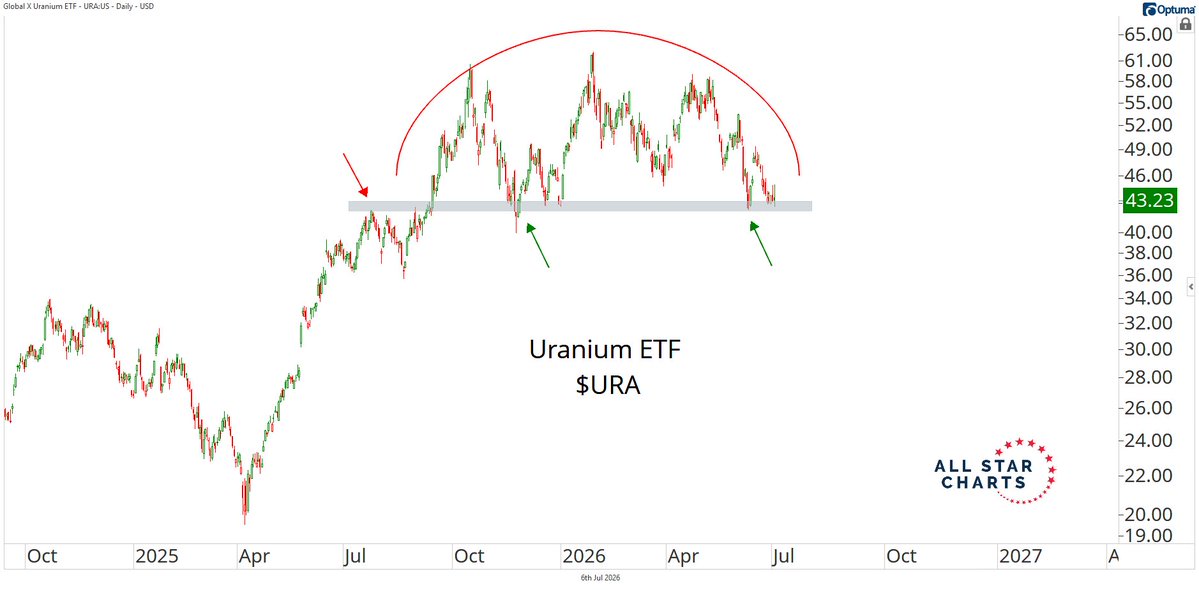
The Global X Uranium ETF (URA) has pulled back to its multi-month support level.
See the full tweet from Alfonso De Pablos.
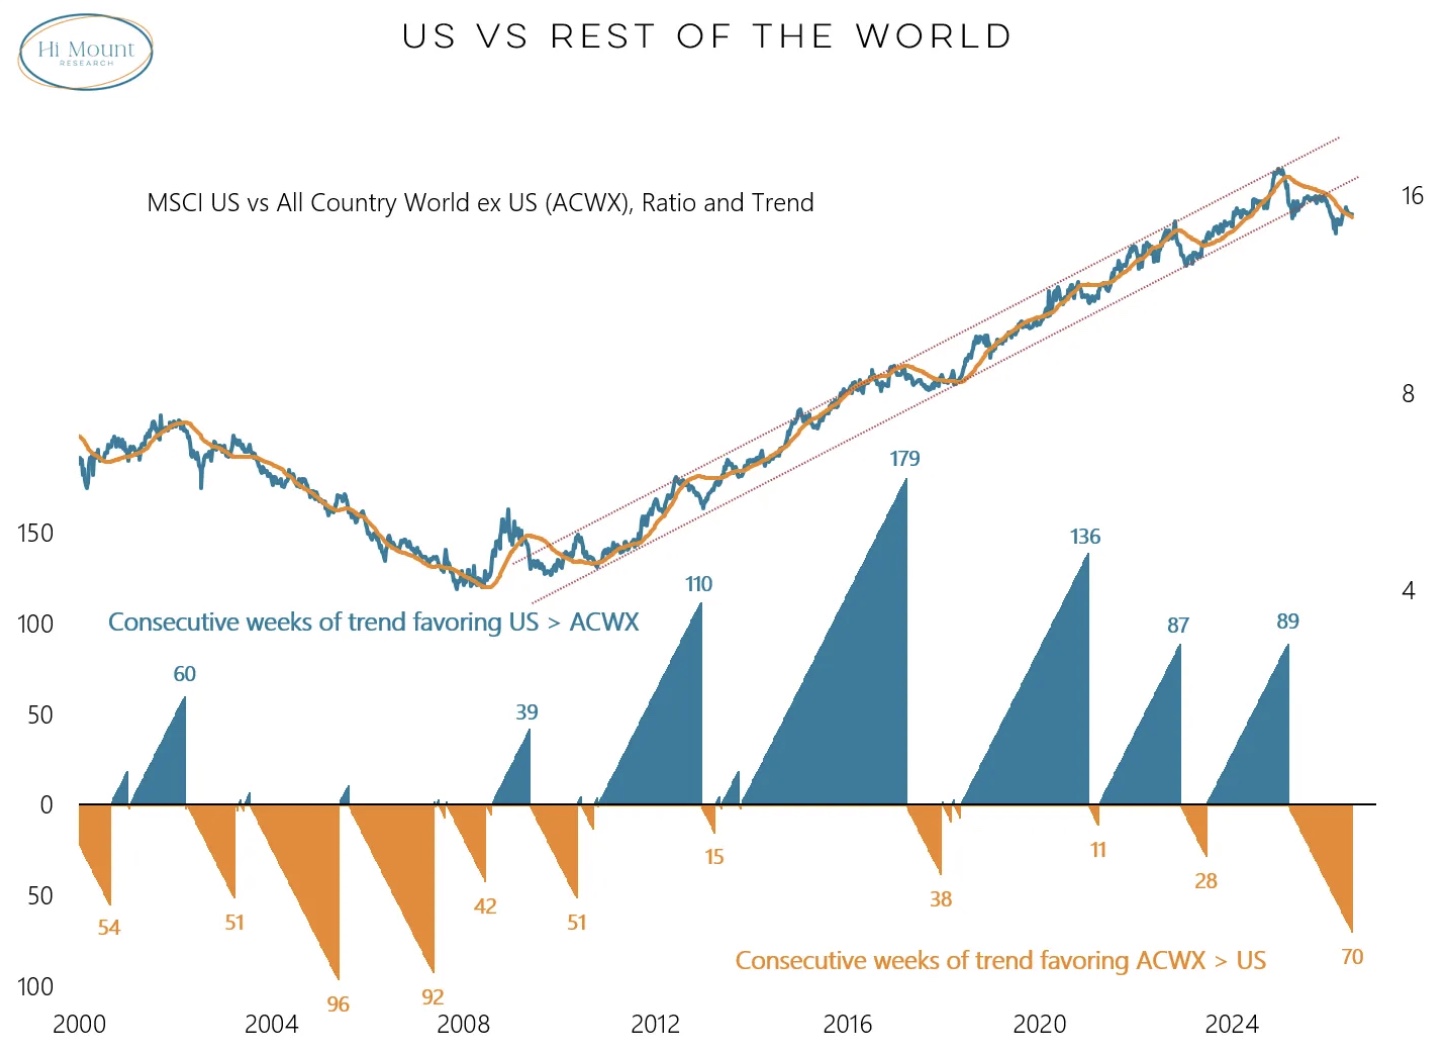
The ACWI ex-U.S. has now outperformed the U.S. for 70 consecutive weeks, marking a shift away from the secular trend that favored U.S. equities following the Financial Crisis.
Check out the latest research from Willie Delwiche.
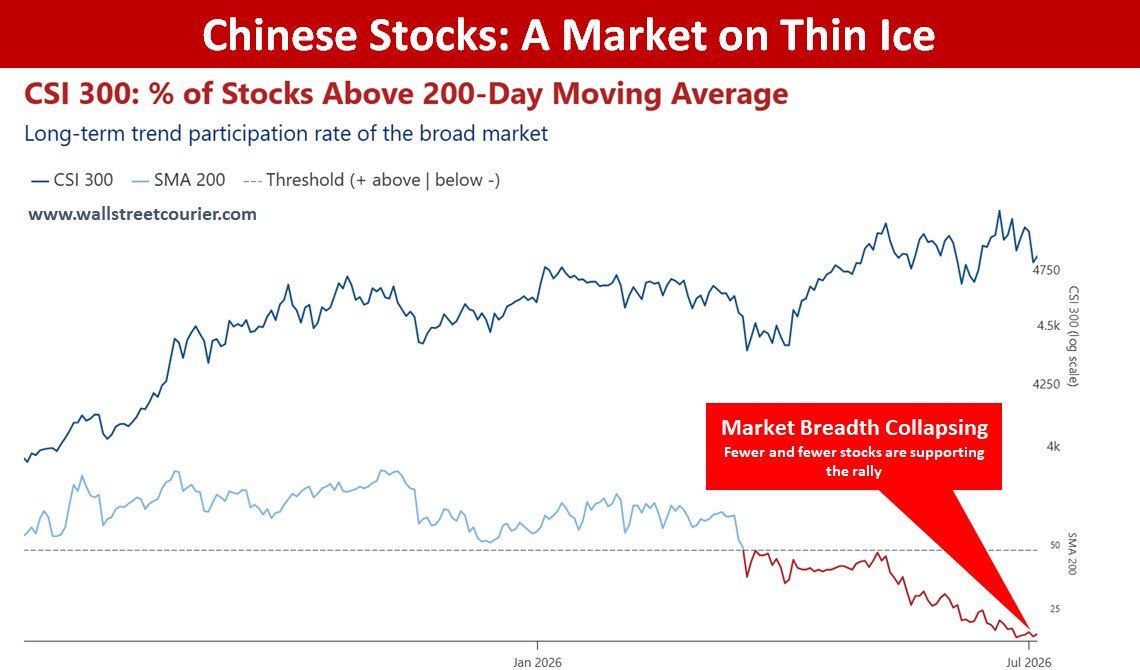
The percentage of Chinese CSI 300 stocks trading above their 200-day moving averages has fallen to extremely low levels.
View the entire post from Wall Street Courier.
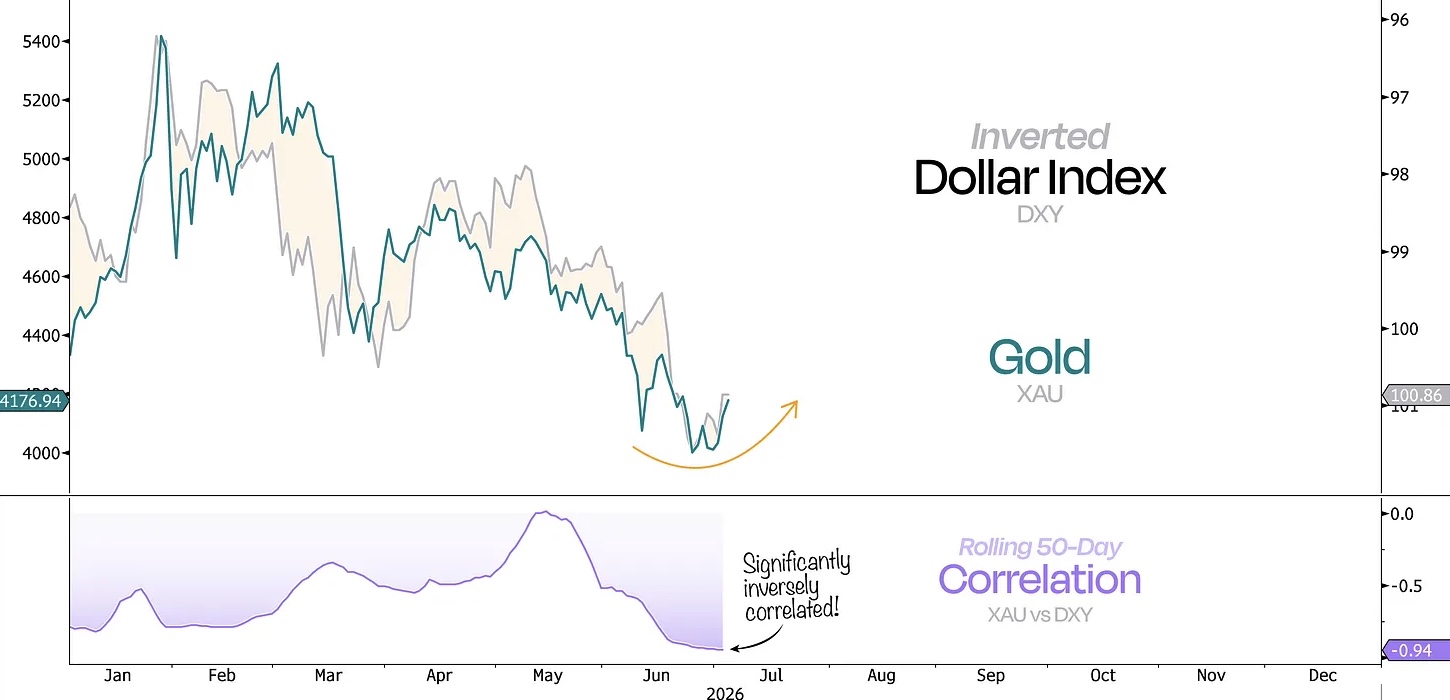
The U.S. Dollar Index and Gold are currently exhibiting an almost perfectly inverse relationship, with their 50-day rolling correlation sitting near -0.94.
Explore the complete article from Duality Research.
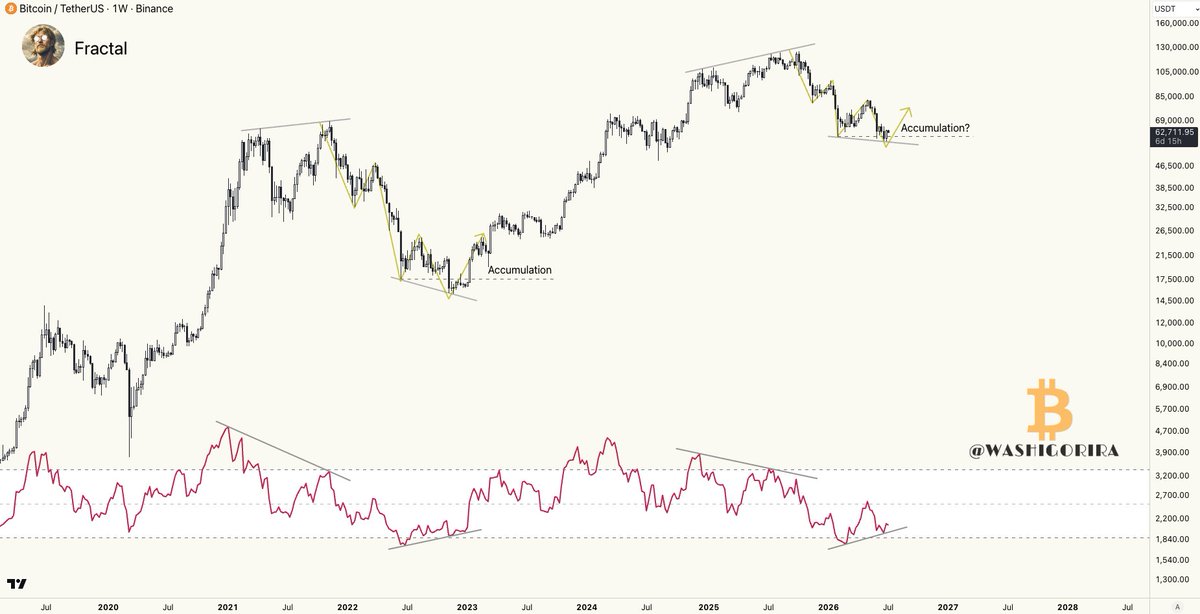
Bitcoin is showing a setup similar to the one seen at its last major cyclical bottom.
See the whole tweet from Washigorira.
The Chart Report curates best-in-class technical analysis from across the web.
If you’d like to share a chart or just say hello, email us at [email protected]