Participation Hits Record Highs 📈 The Chart Report

Chart of the Day
🏆 Today's Chart of the Day was shared by A.J. Gregor.
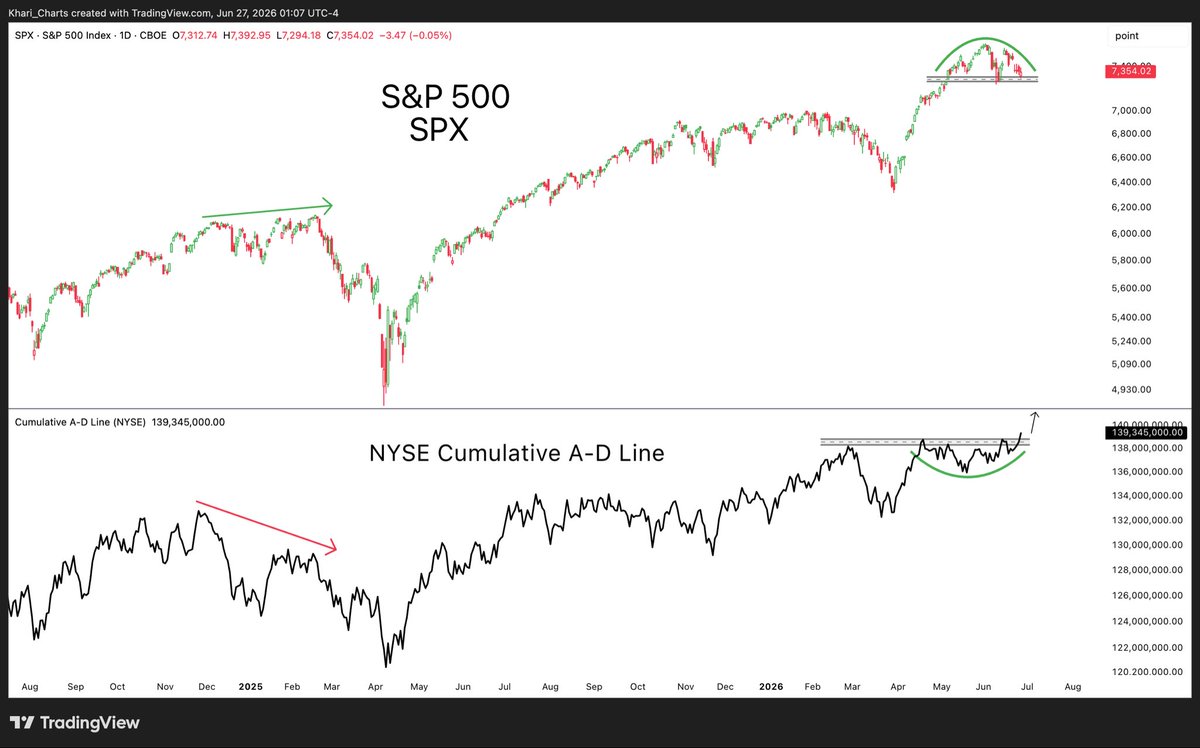
While the S&P 500 remains in a modest -2.15% drawdown, both the S&P 500 and NYSE Advance-Decline Lines are making new all-time highs.
In the first quarter of last year, breadth diverged negatively for months before the market rolled over into April.
This time, however, breadth is breaking out as the S&P 500 consolidates its gains from the March lows, suggesting the recent volatility was driven more by sector rotation than broad-based selling.
The Takeaway: Despite the S&P 500's near-term pause, the market's internals continue to improve.
More Great Charts
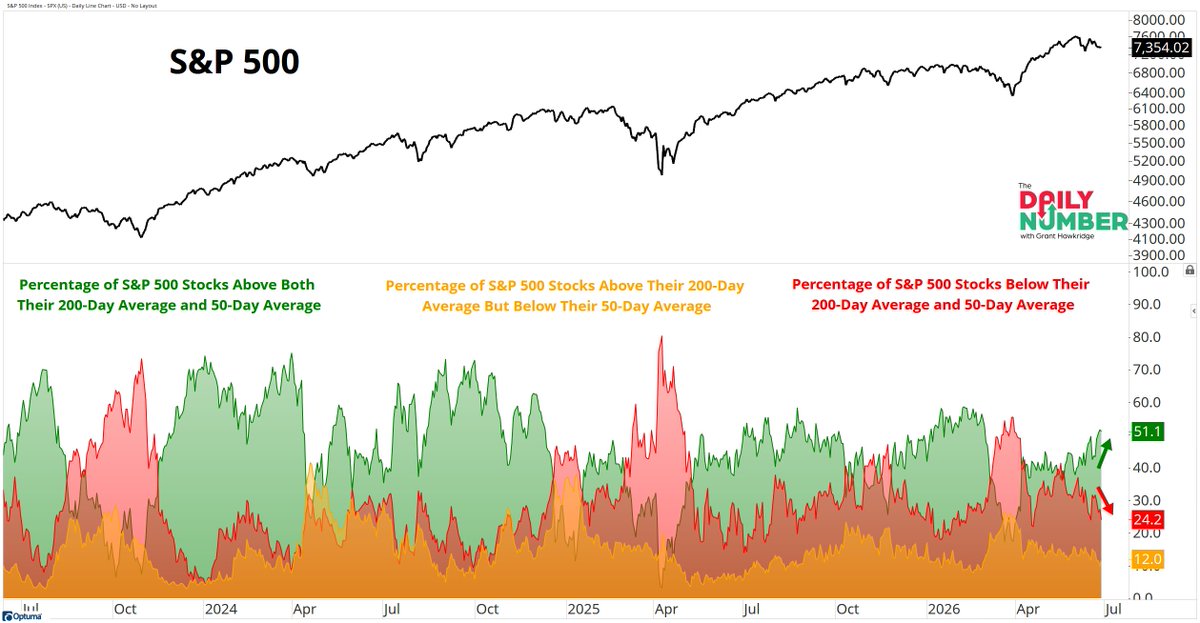
More stocks are getting back into established uptrends, with over half of S&P 500 stocks now above both their 50-day and 200-day moving averages.
View the full post from Grant Hawkridge.
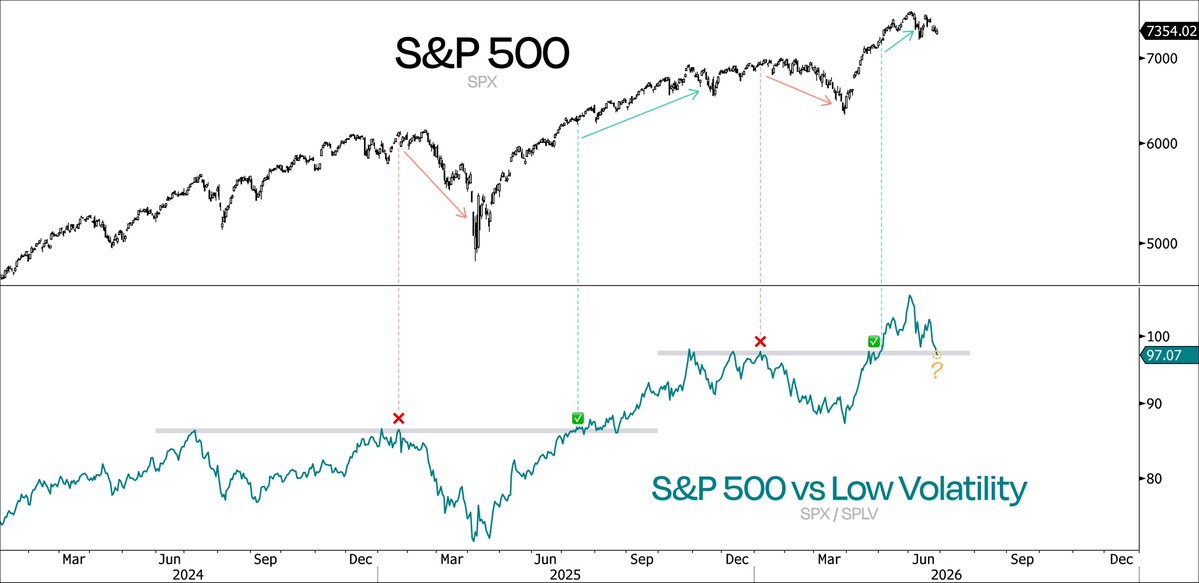
The S&P 500 is testing its former resistance level relative to Low Volatility.
Check out the entire article from Duality Research.
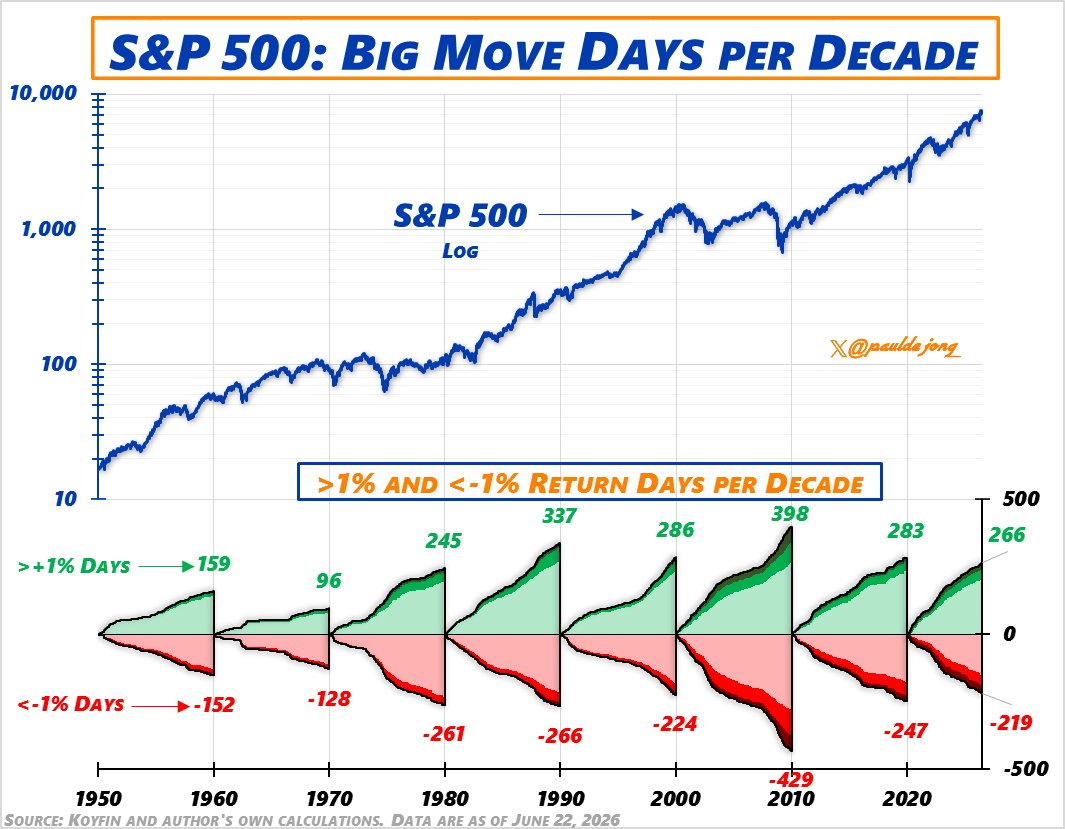
Just over halfway through the decade, the market is on pace to record more 1% up days than during the entire 2010s.
See the whole tweet from Paul De Jong.
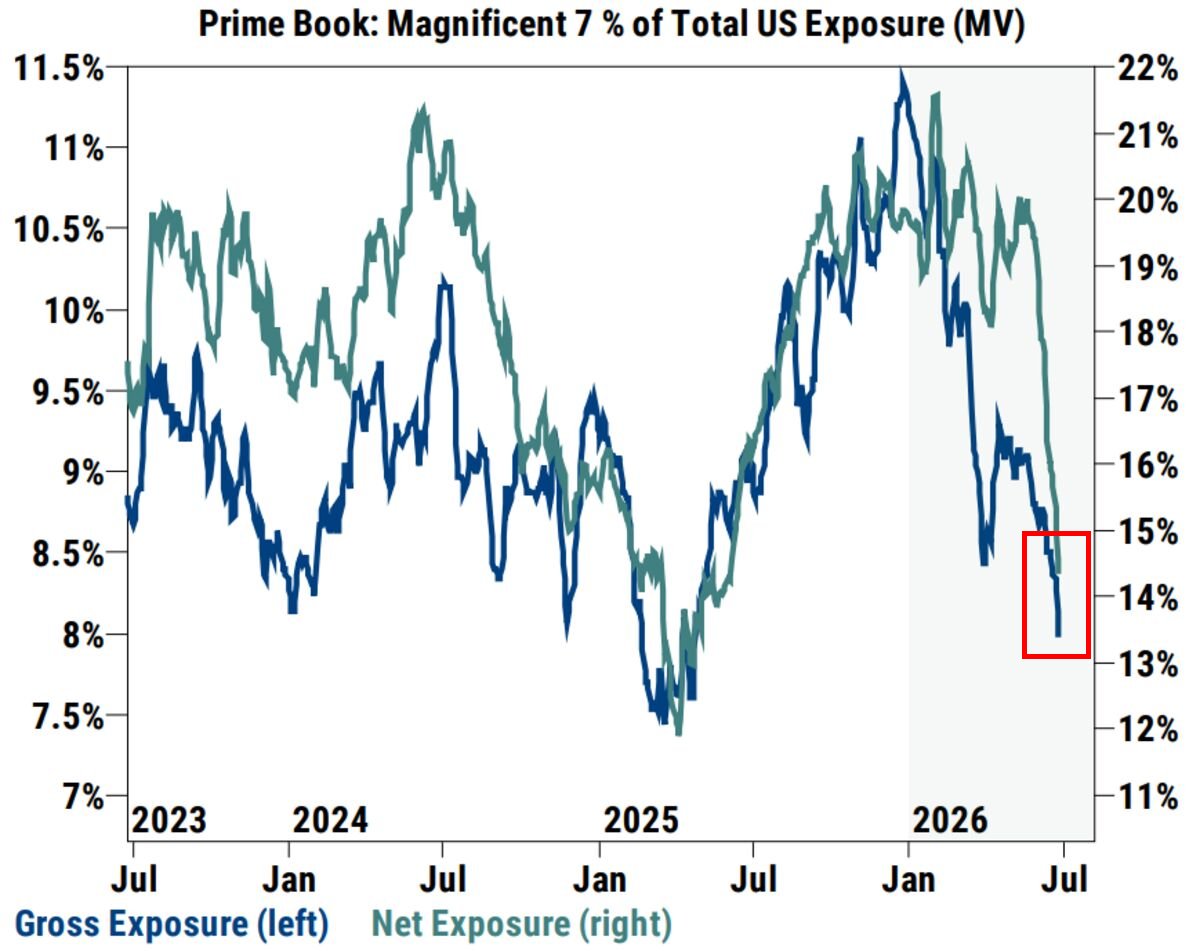
Exposure to the Magnificent Seven is approaching multi-year lows.
Examine the complete post from Macro Charts.
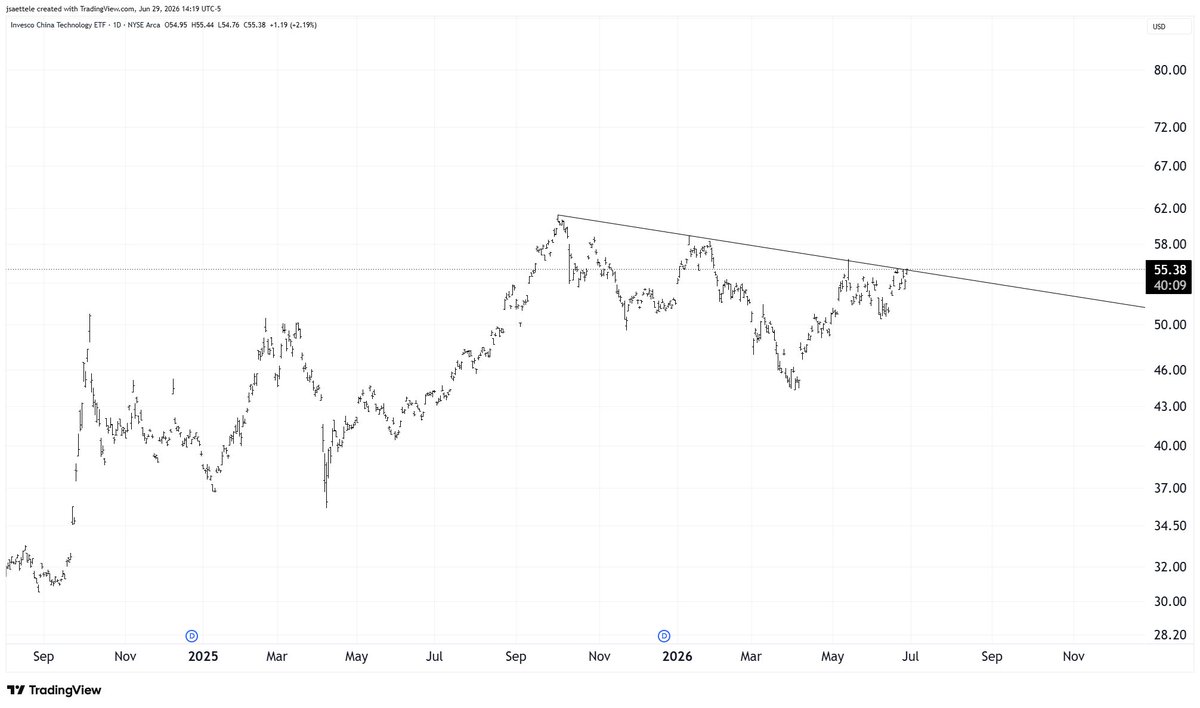
The China Technology ETF (CQQQ) is nearing a potential breakout from its downward trendline.
View the full post from Jamie Saettele.
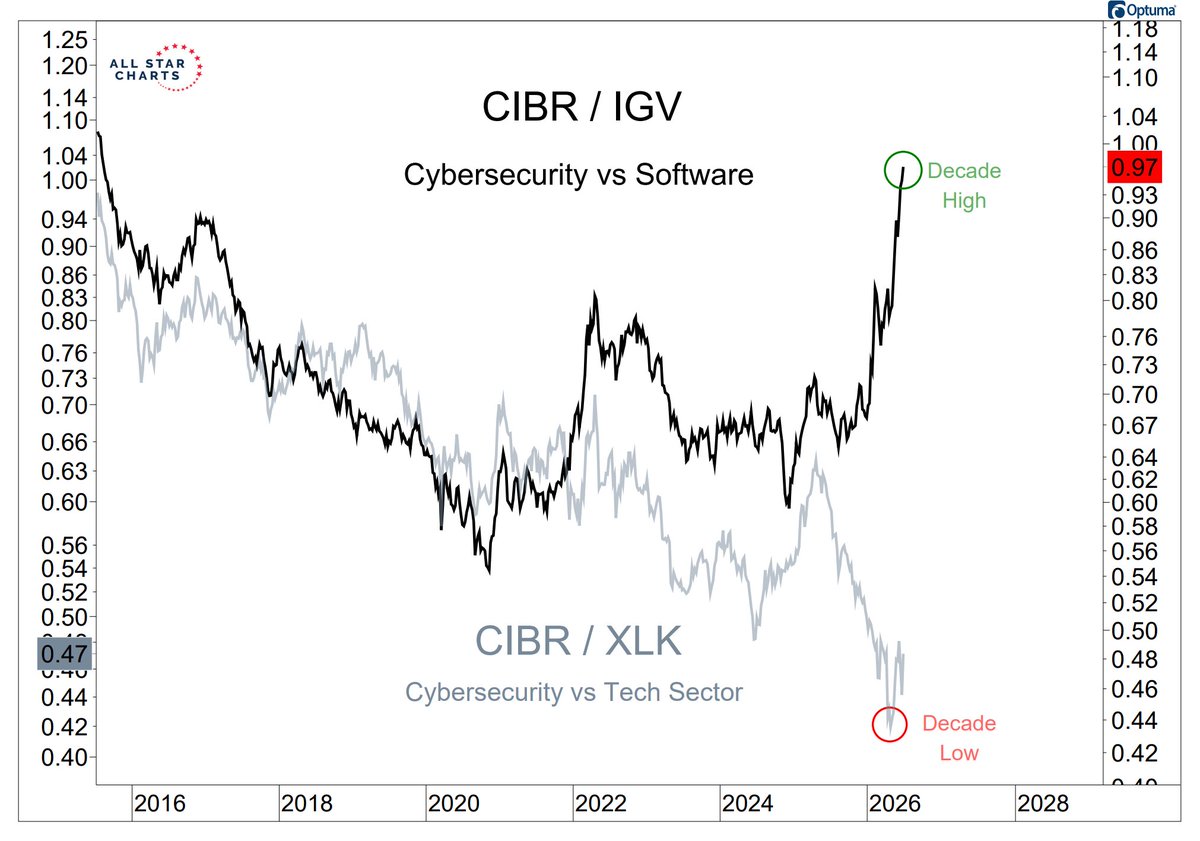
Cybersecurity stocks are making new decade highs relative to Software while remaining near decade lows relative to the broader Technology sector.
Check out the entire tweet from Ricardo Sarraf.
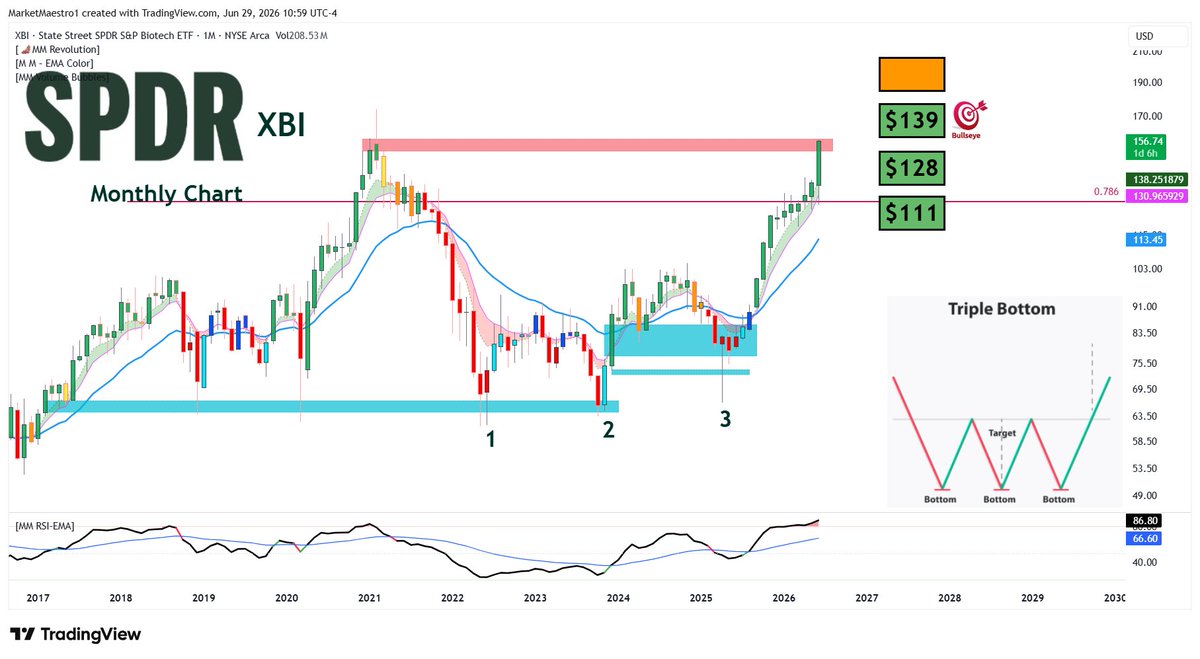
The Equal Weight Biotech ETF (XBI) is on pace to finish June with its highest monthly close on record.
See the whole post from Market Maestro.
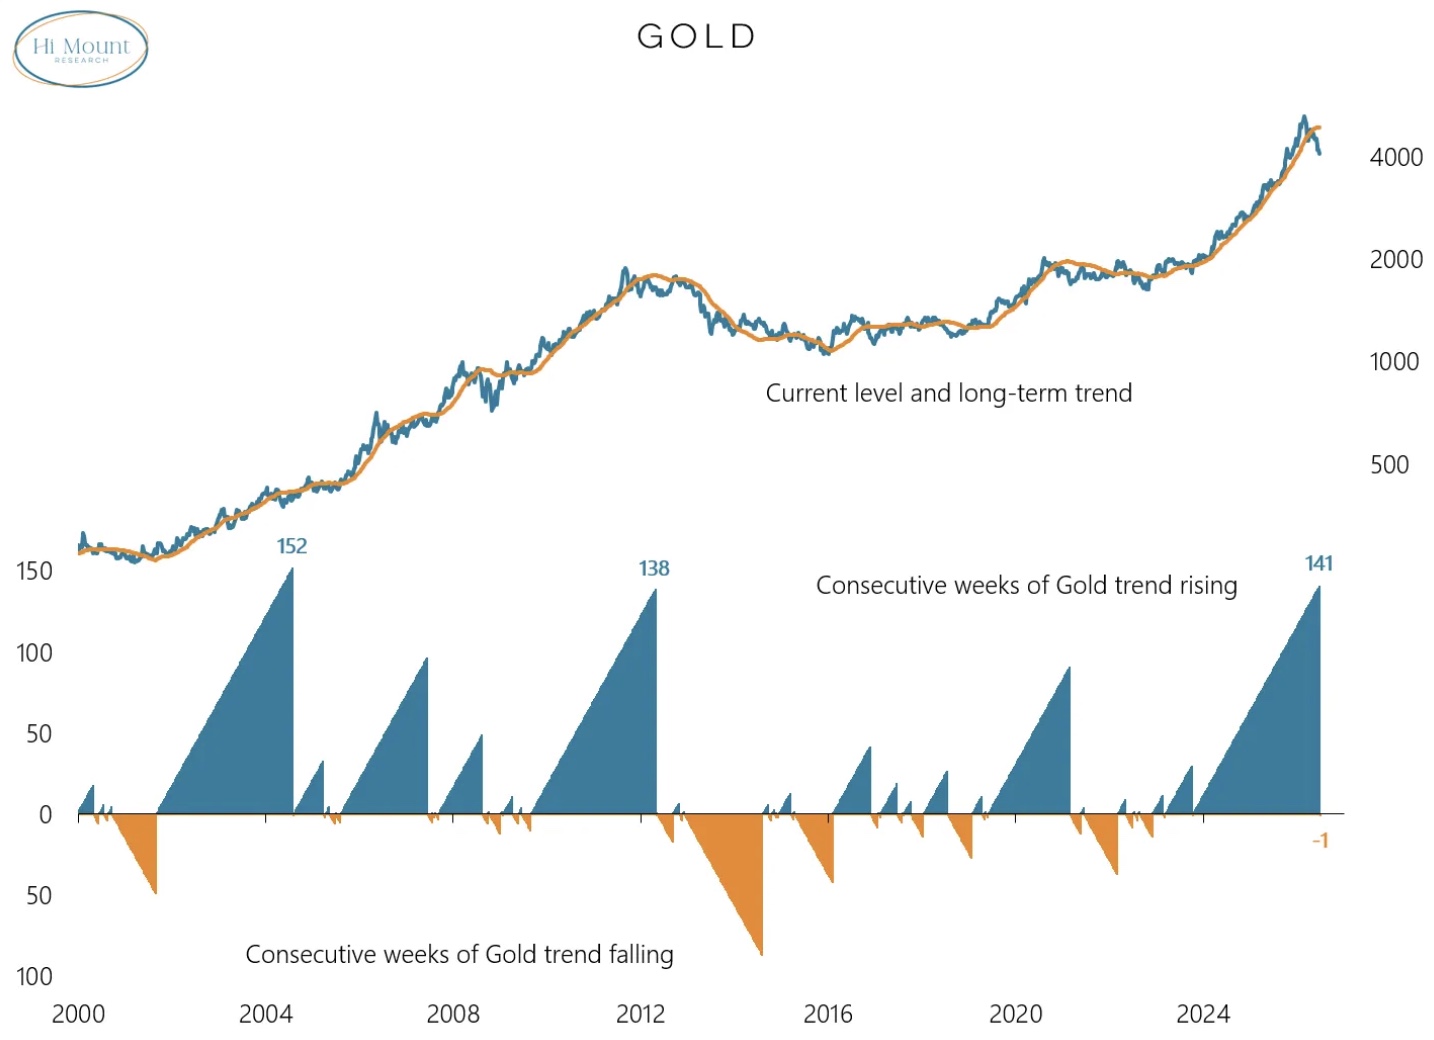
After 141 consecutive weeks in a long-term uptrend, the longest streak in more than two decades, Gold's trend has turned lower.
Explore the complete article from Willie Delwiche.
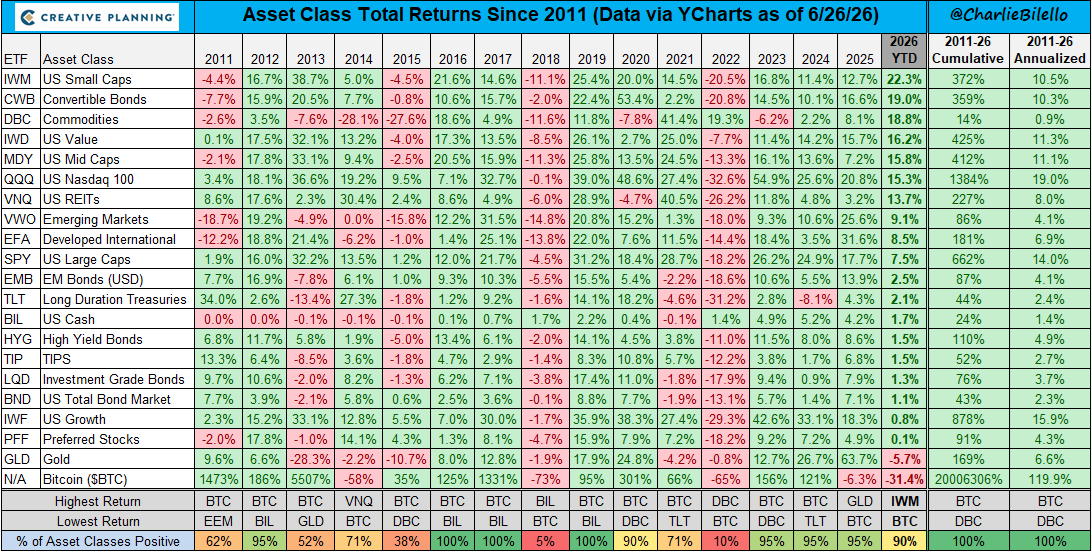
Bitcoin and Gold have been the two worst-performing major asset classes in 2026, something that has never happened before in a calendar year.
Watch the full analysis from Charlie Bilello.
The Chart Report curates best-in-class technical analysis from across the web.
If you’d like to share a chart or just say hello, email us at [email protected]