Semiconductors’ Best Quarter in History 📈 The Chart Report

Chart of the Day
🏆 Today's Chart of the Day was shared by Bluekurtic.
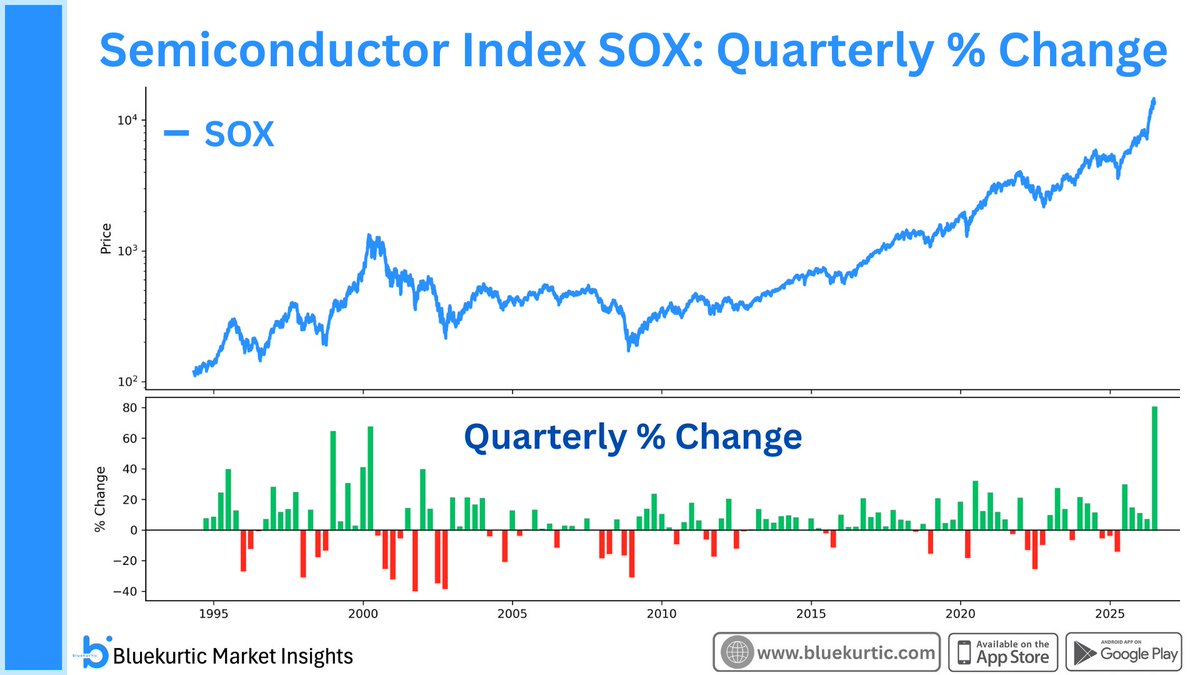
The Semiconductor Index (SOX) saw an intra-month drawdown of more than 12%, yet clawed its way back to finish June with a new all-time monthly closing high.
It also just logged its strongest quarter in history, outpacing the best quarterly performance of the dot-com era by nearly 20%.
Continued strength from semis remains an encouraging sign for stocks, as they've been the market's clear leadership group throughout this bull market.
The Takeaway: Semiconductors just delivered a record quarter and continue to lead the way higher.
More Great Charts
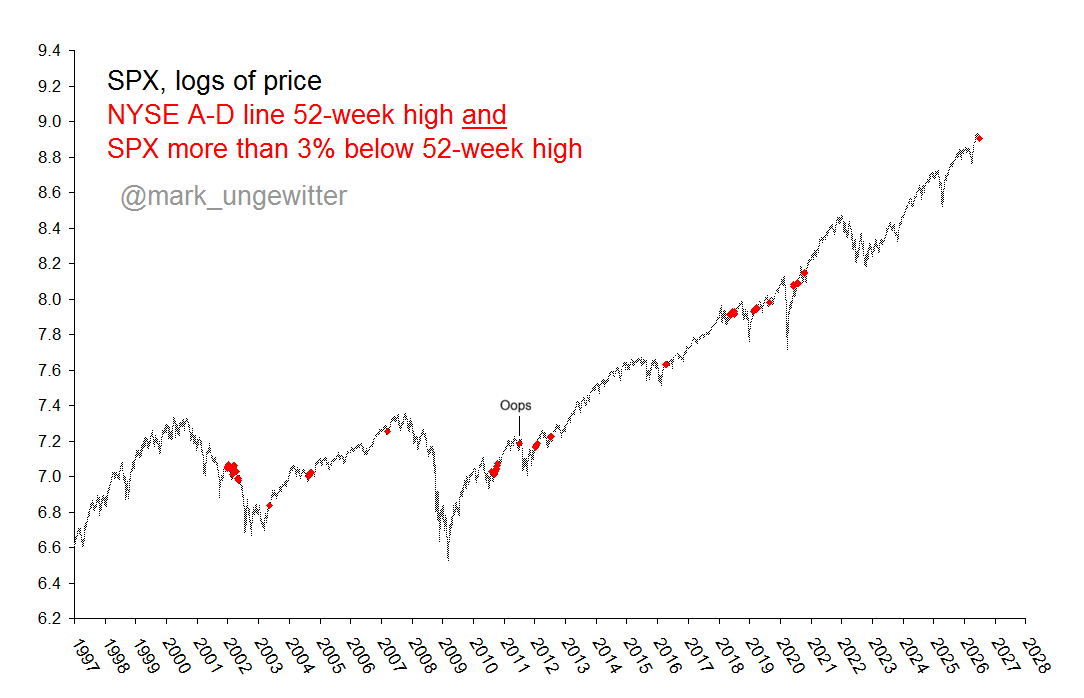
The NYSE Advance-Decline Line has normally led the S&P 500 to new highs.
View the full post from Mark Ungewitter.
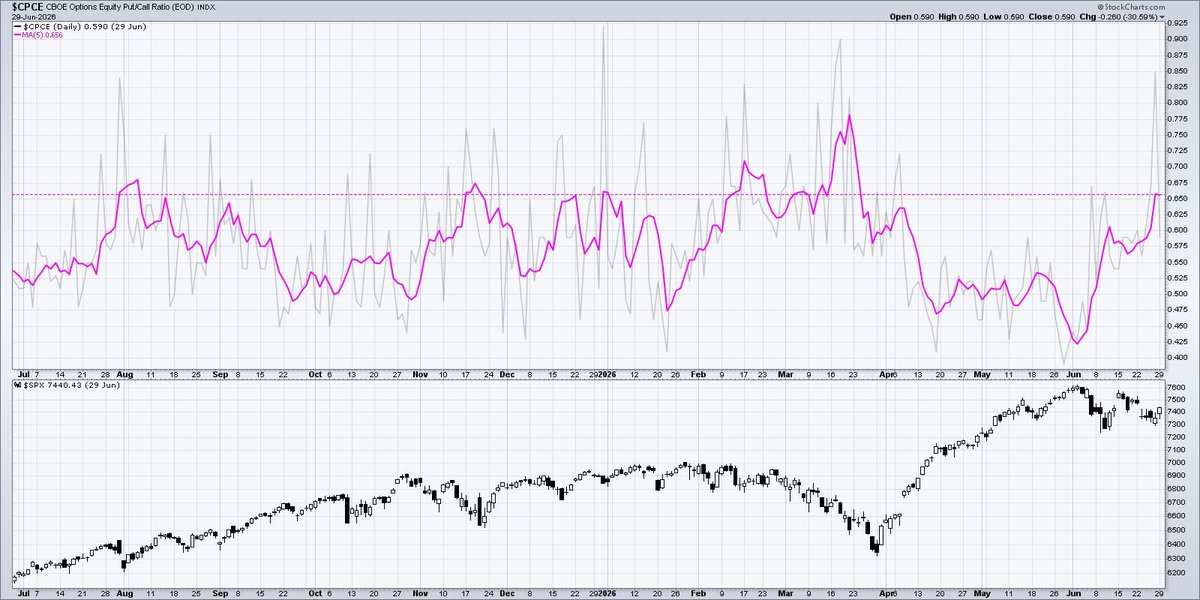
The Put/Call ratio spiked to extreme levels last Friday, with similar moves often aligning with short-term market lows.
See the entire tweet from David Keller.
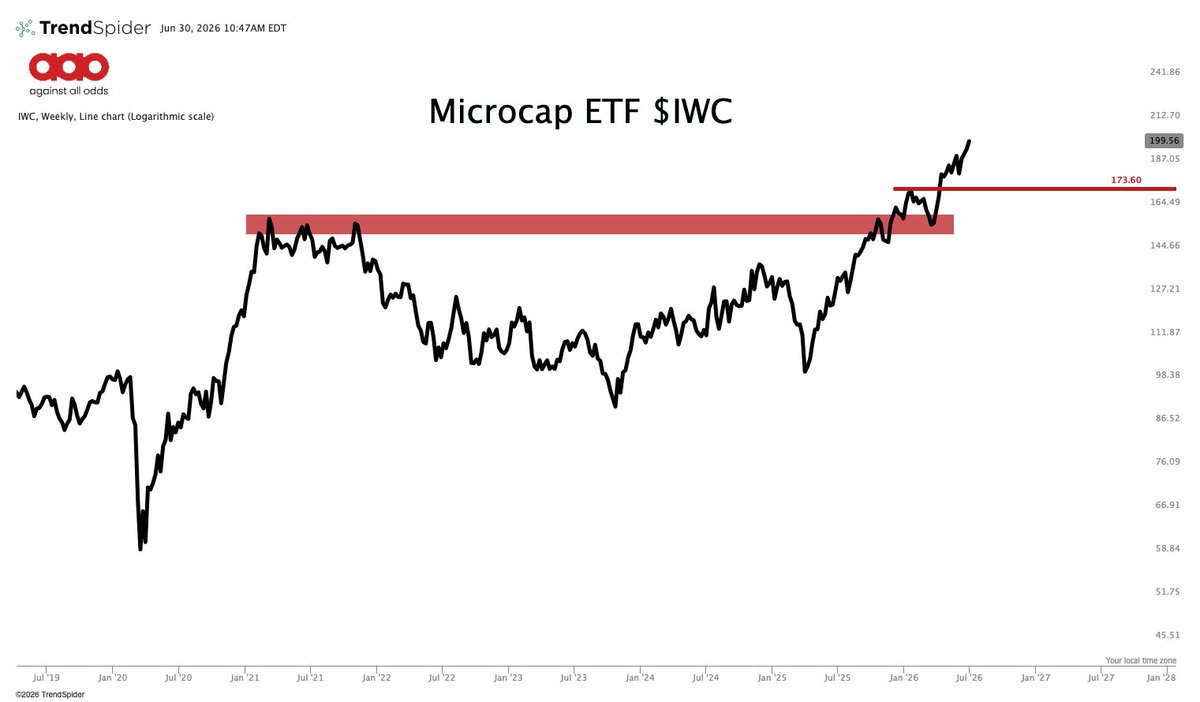
Micro-Caps just closed at new all-time highs.
Examine the whole post from Jason Perz.
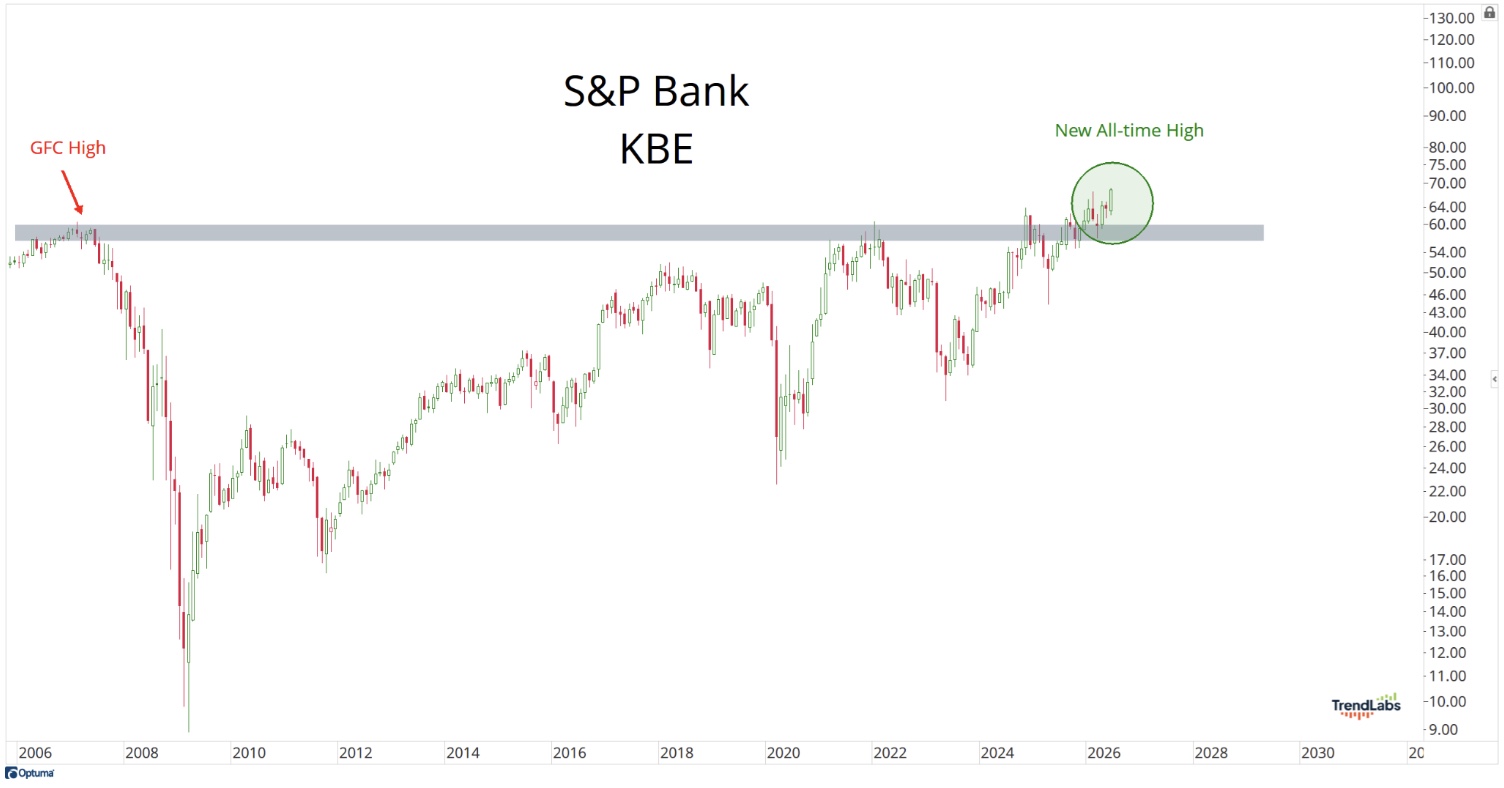
The S&P Bank Index finished June with its highest monthly close on record.
Read the complete article from J.C. Parets.
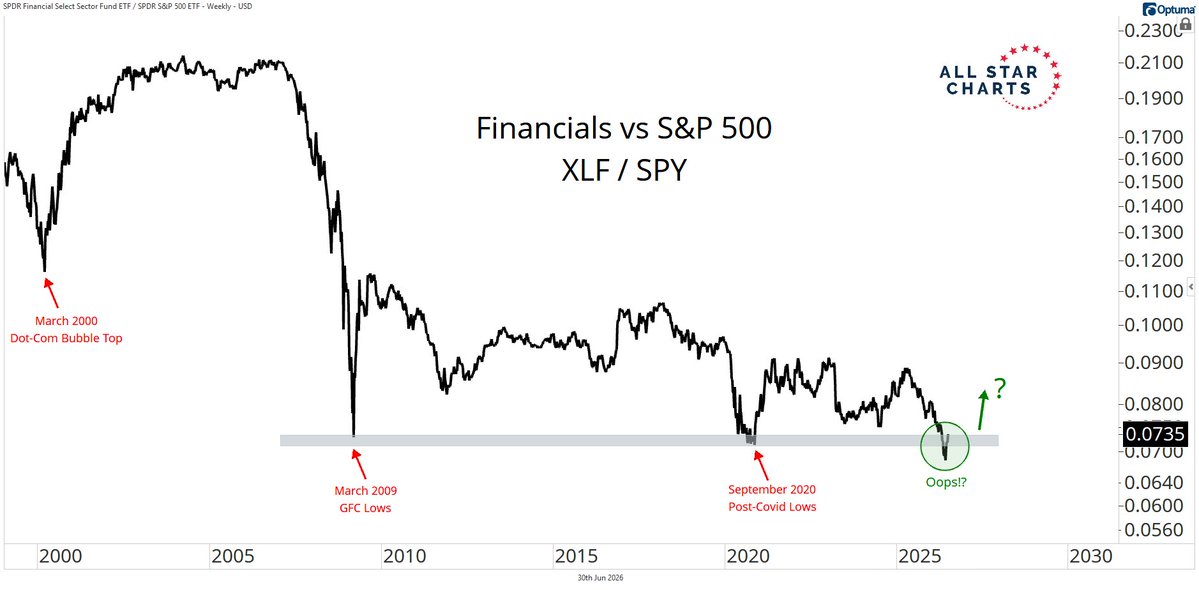
Financials are undergoing a potential failed breakdown relative to the S&P 500.
Check out the full analysis from Alfonso De Pablos.
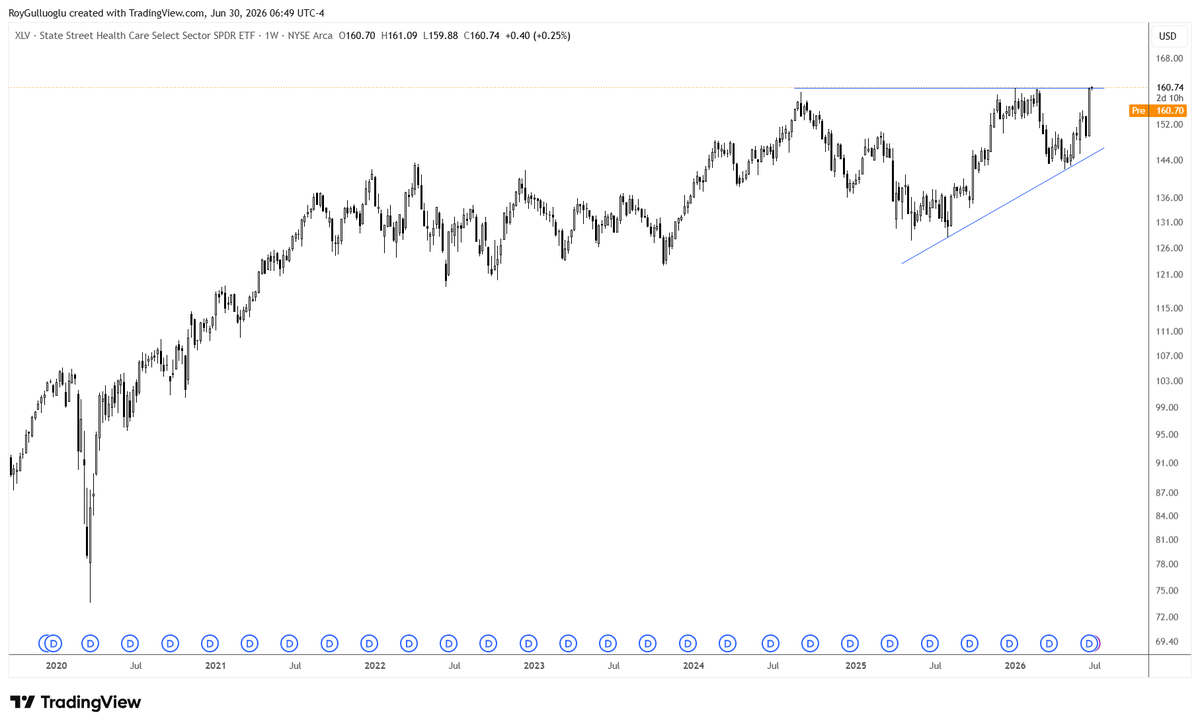
The Healthcare Sector ETF is forming a roughly 2-year ascending triangle pattern.
View the entire tweet from Roy Gulluoglu.
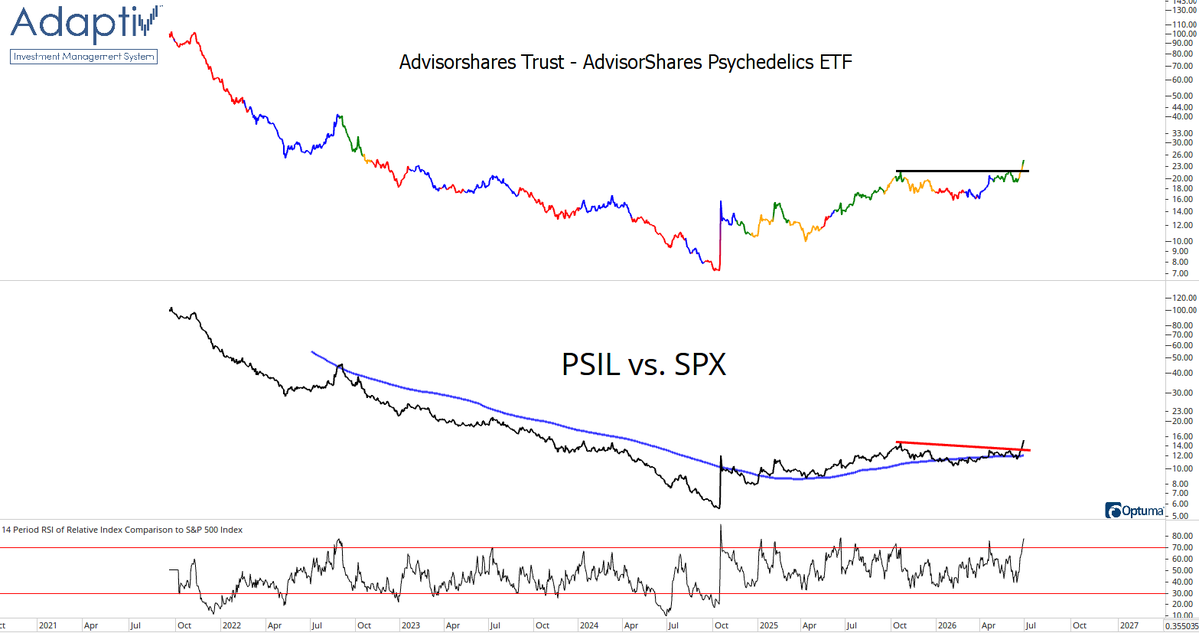
The Psychedelics ETF is making new 3-year highs while also breaking out relative to the broader market.
See the complete post from Ian McMillan.
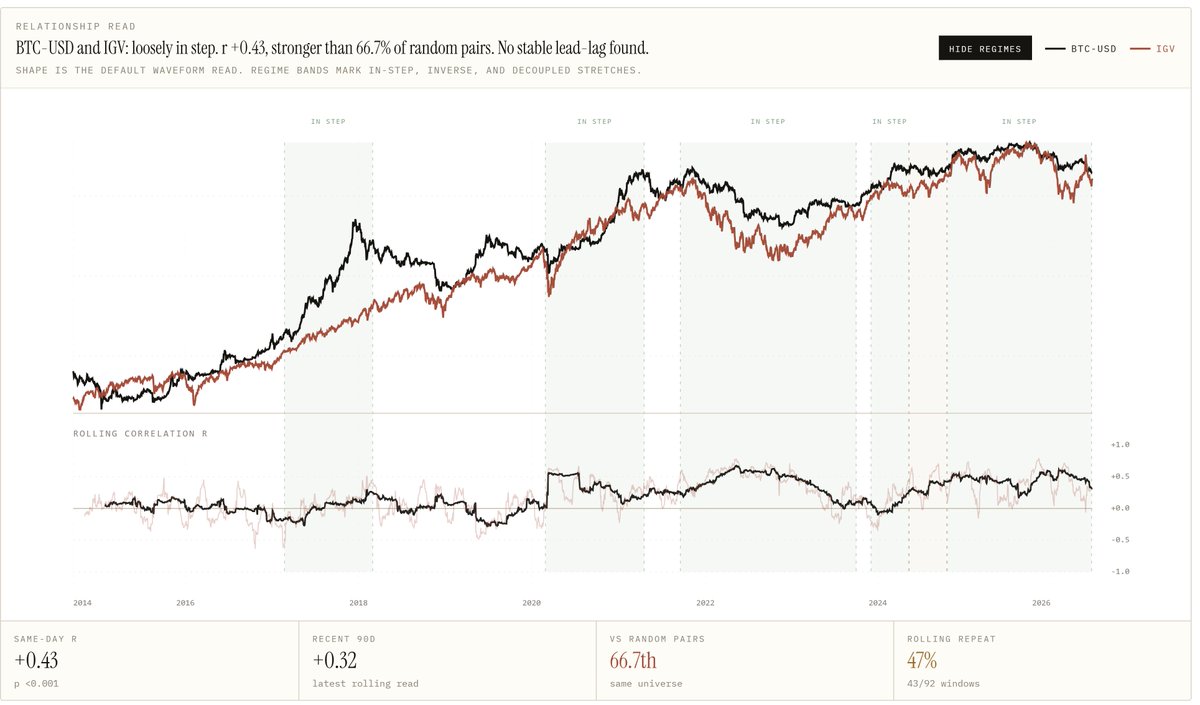
The correlation between Bitcoin and Software has increased over time, with the two largely moving in lockstep since 2021.
Examine the whole tweet from The Orion Engine.
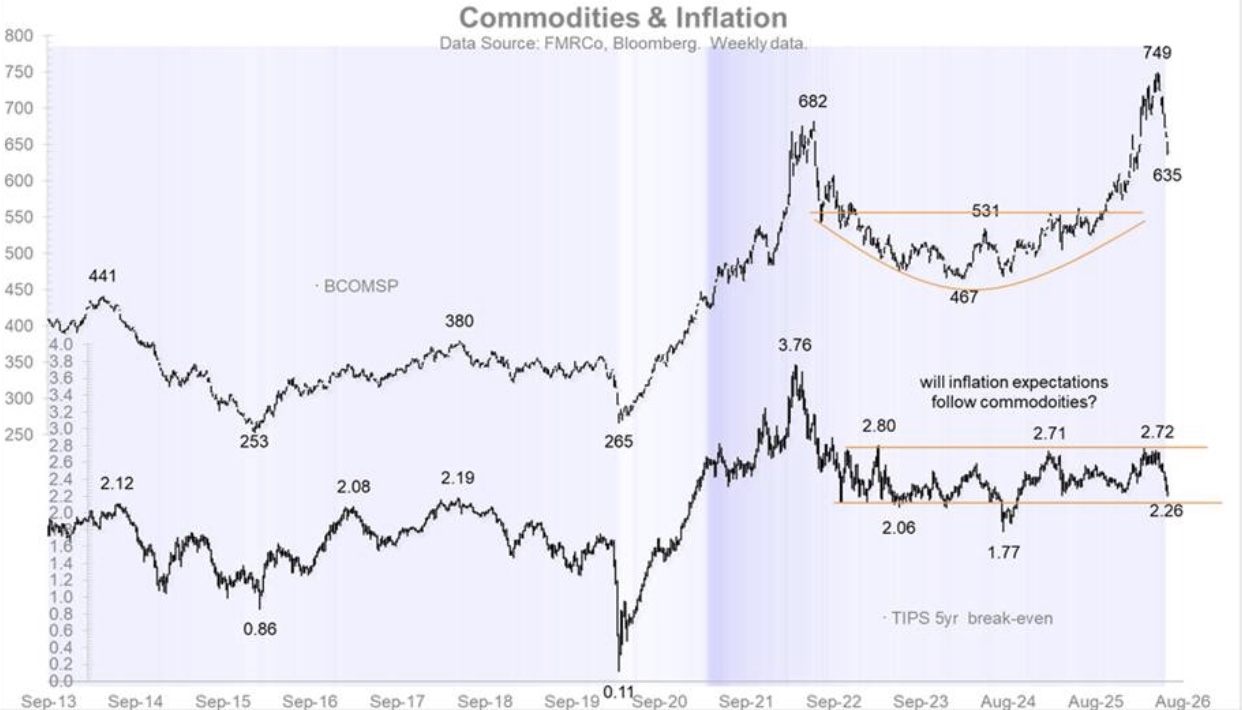
Both the Bloomberg Commodity Index and 5-year inflation expectations have failed to break out.
Explore the full article from Jurrien Timmer.
The Chart Report curates best-in-class technical analysis from across the web.
If you’d like to share a chart or just say hello, email us at [email protected]