What's Wrong With Microsoft? 📉 The Chart Report

Chart of the Day
🏆 Today's Chart of the Day was shared by Connor Bates.
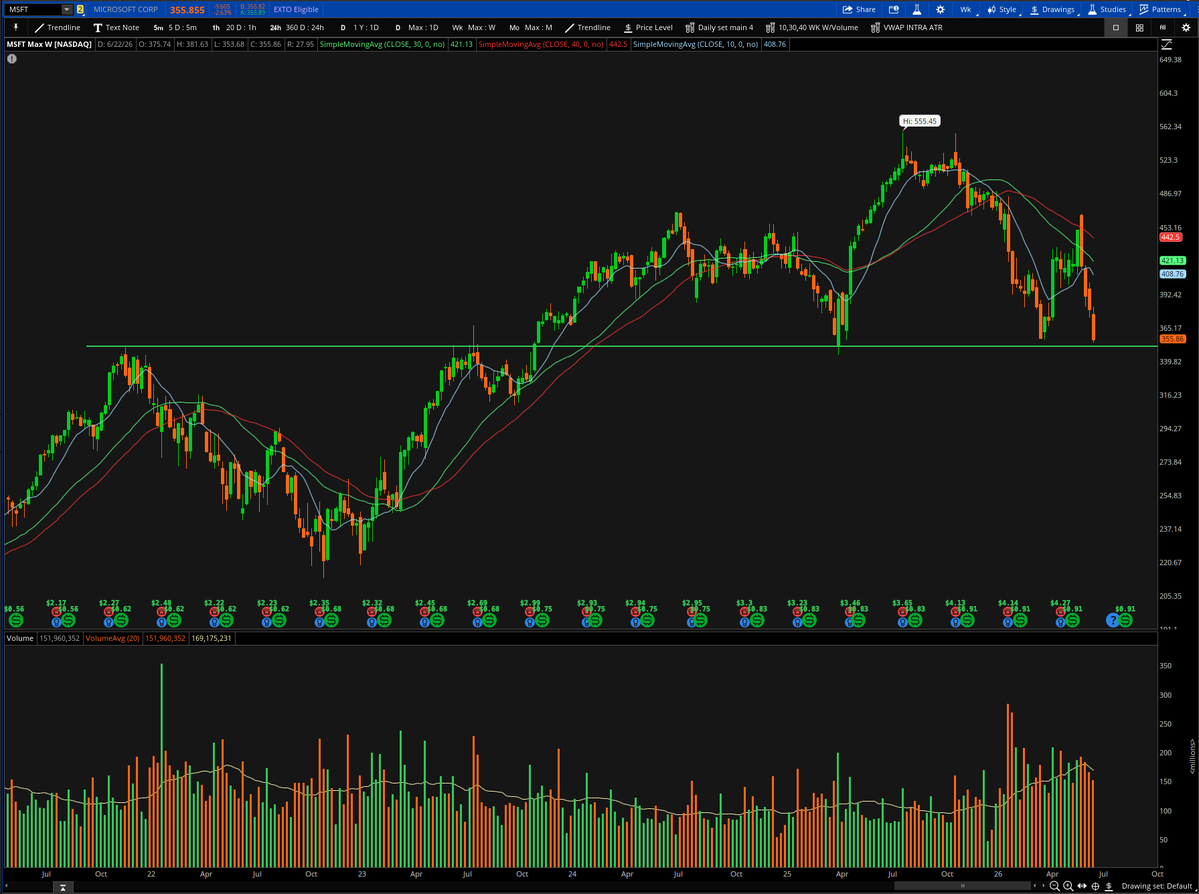
Microsoft closed at a new 52-week low and has retraced back to its major long-term polarity level near $350.
The stock has formed what appears to be a deformed right shoulder within a head-and-shoulders top while on track for its worst month since December 2000.
Microsoft has already completed a multi-year top relative to the S&P 500, and a breakdown in absolute terms would be noteworthy, especially in the middle of a bull market.
The Takeaway: The world's largest software company is testing a critical level.
More Great Charts
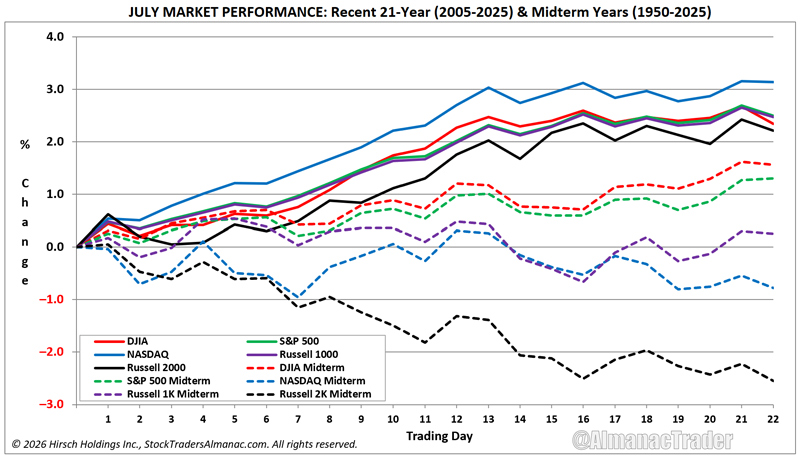
History favors the bulls in July.
Check out the full article from Jeff Hirsch.
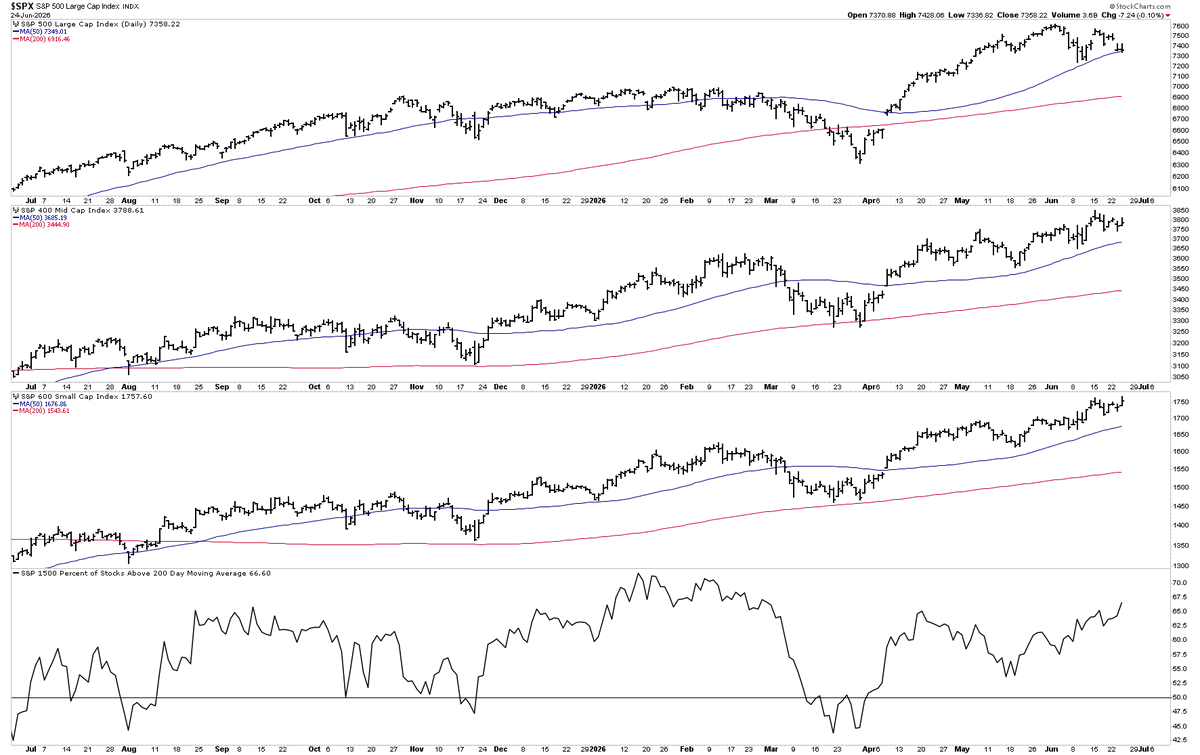
While large-cap stocks remain stuck in a trading range, the uptrends in mid and small caps remain intact.
See the whole tweet from Louis Spector.
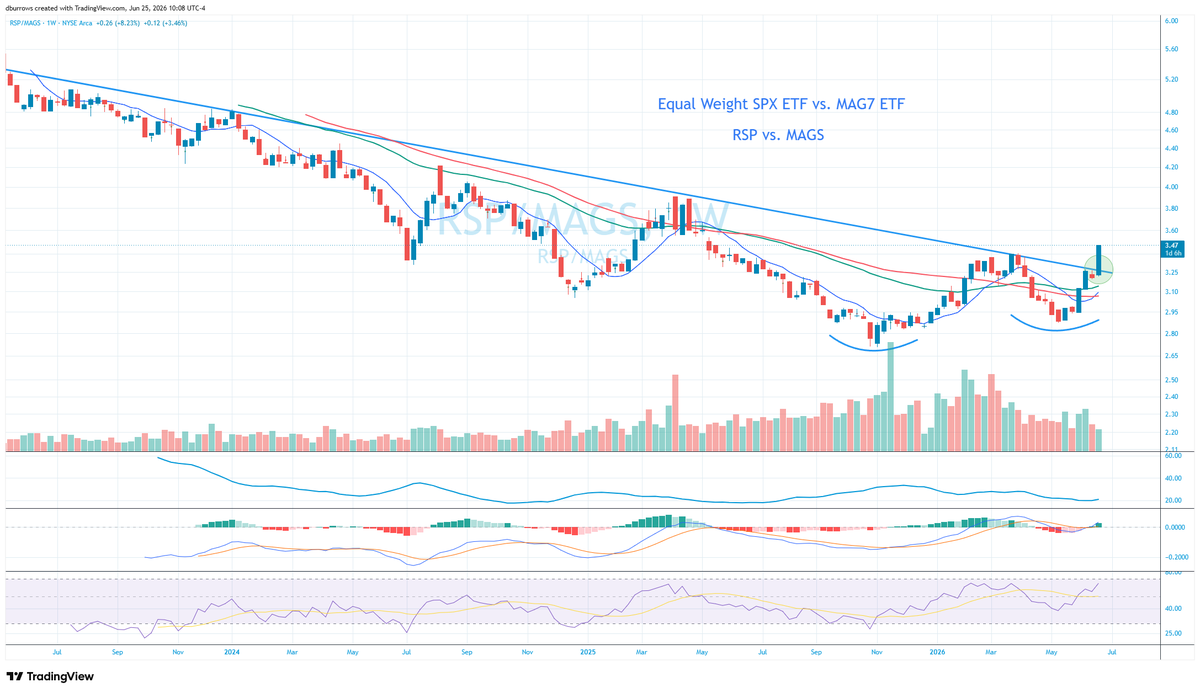
The Equal Weight S&P 500 is breaking above a multi-year downtrend line relative to the Magnificent Seven.
View the complete post from David Burrows.
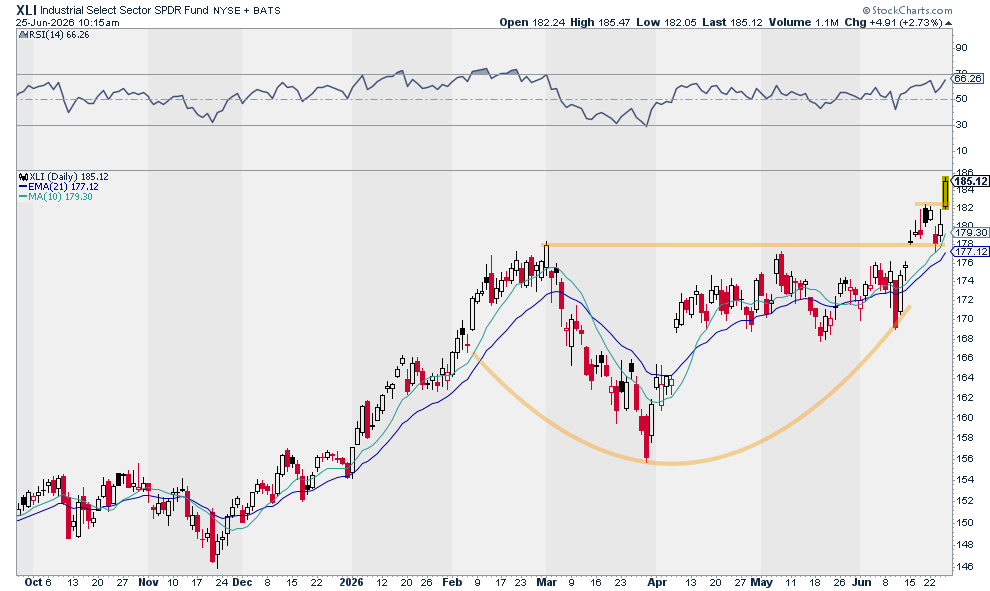
The Industrials Sector ETF closed at new all-time highs.
Examine the entire tweet from Justin Spittler.
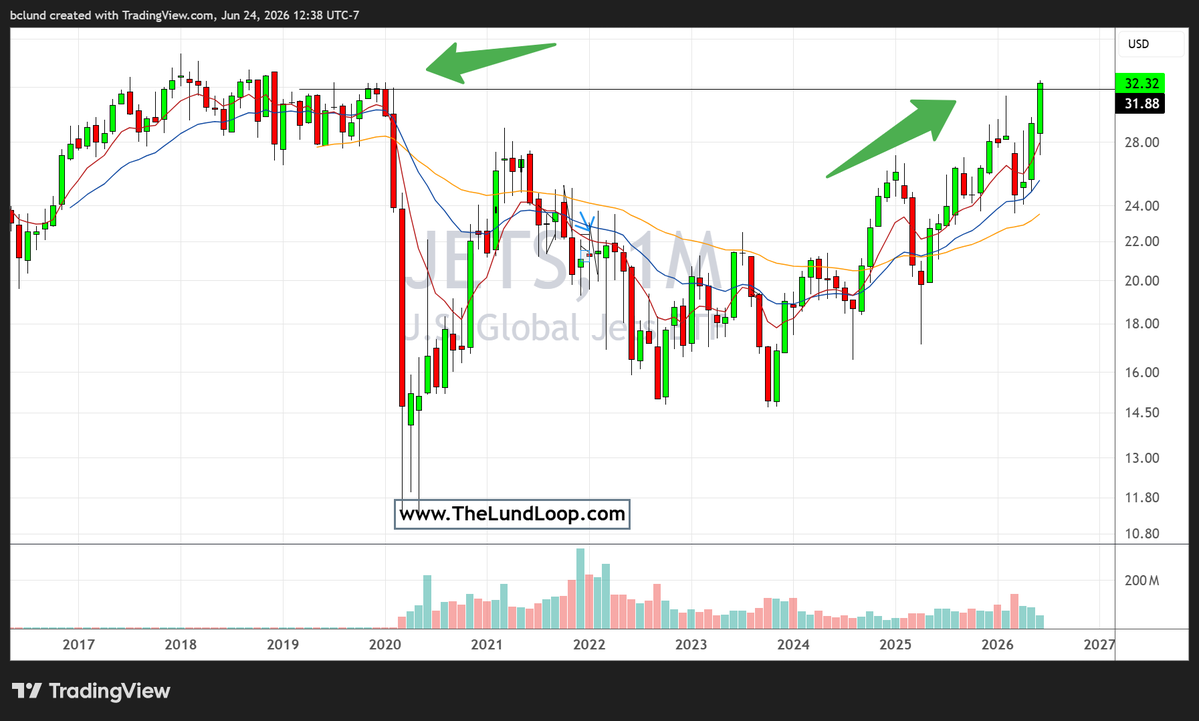
The Global Jets ETF is back to its pre-Covid levels after six years.
Check out the full post from Brian Lund.
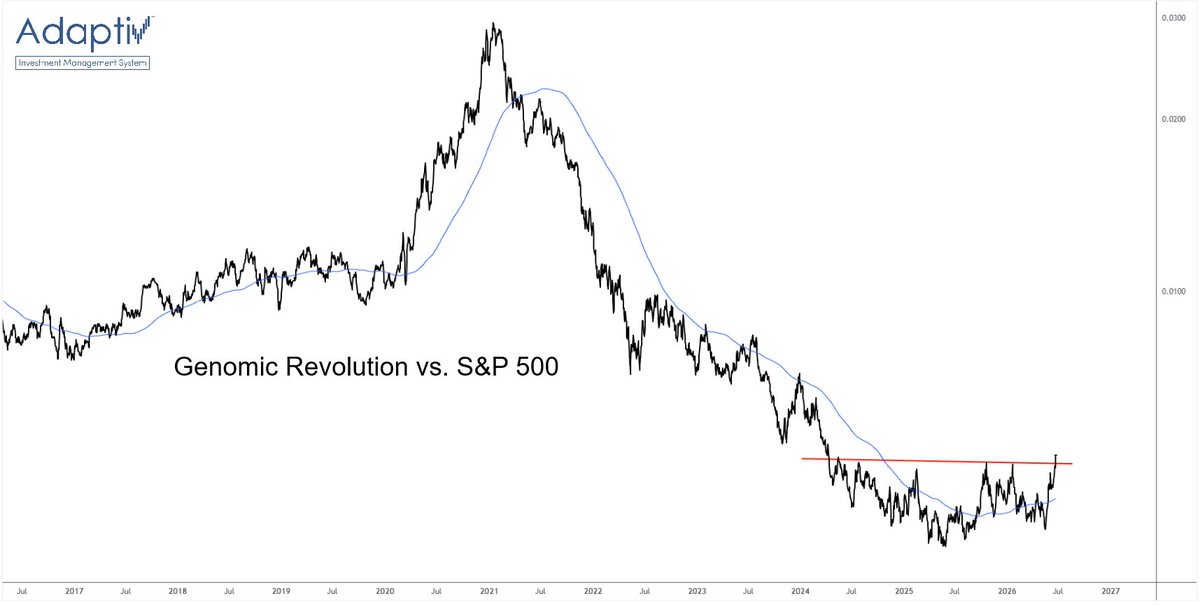
The Genomics ETF is making new 2-year highs relative to the S&P 500
See the whole tweet from Ian McMillan.
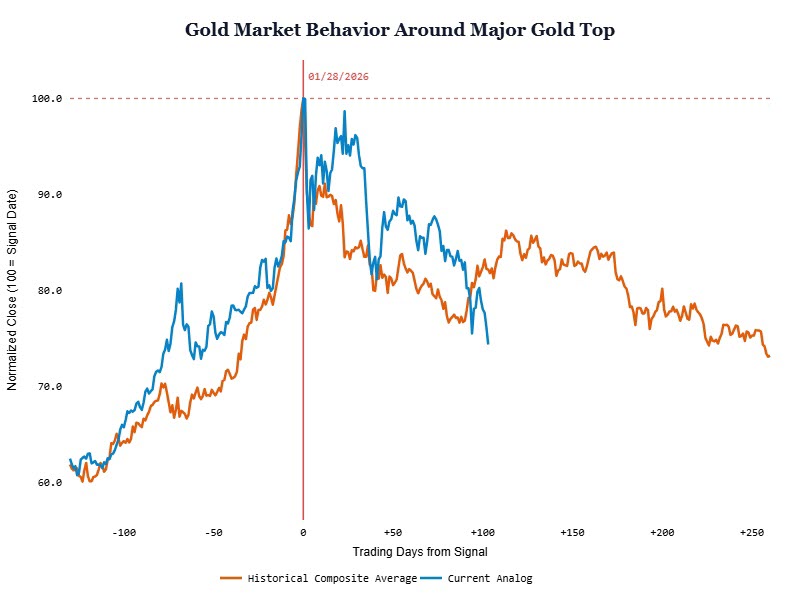
Gold continues to mirror the historical blowoff top composite.
View the complete post from Turning Point Market Research.
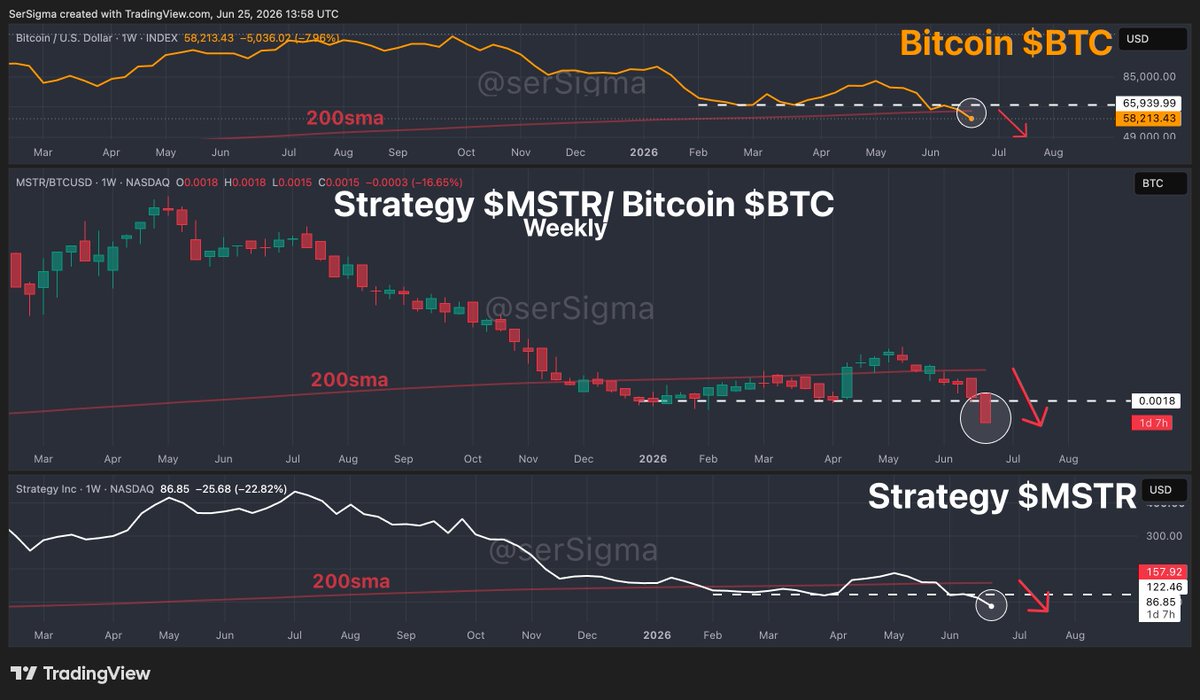
Strategy is leading Bitcoin to the downside.
Examine the entire tweet from SerSigma.
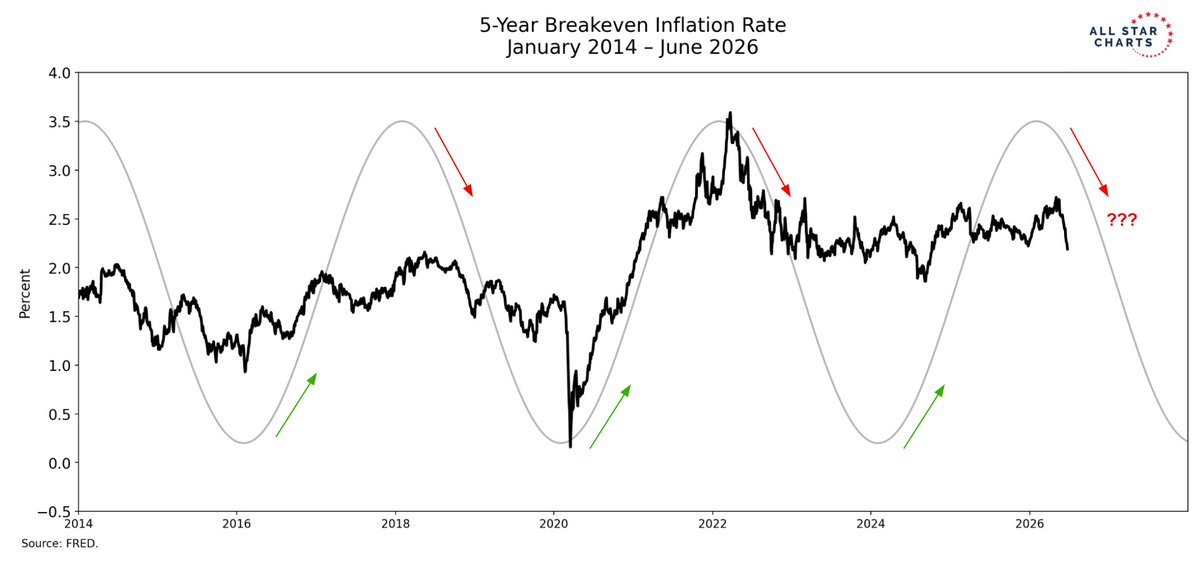
The 5-Year Breakeven Inflation Rate failed to breakout and is back in the same range it's been stuck in since 2022, with the overlay suggesting a peak right around now.
View the full post from Ricardo Sarraf.
The Chart Report curates best-in-class technical analysis from across the web.
If you’d like to share a chart or just say hello, email us at [email protected]