Technology's Moment of Truth 📈 The Chart Report

Chart of the Day
🏆 Today's Chart of the Day was shared by Chris Kimble.
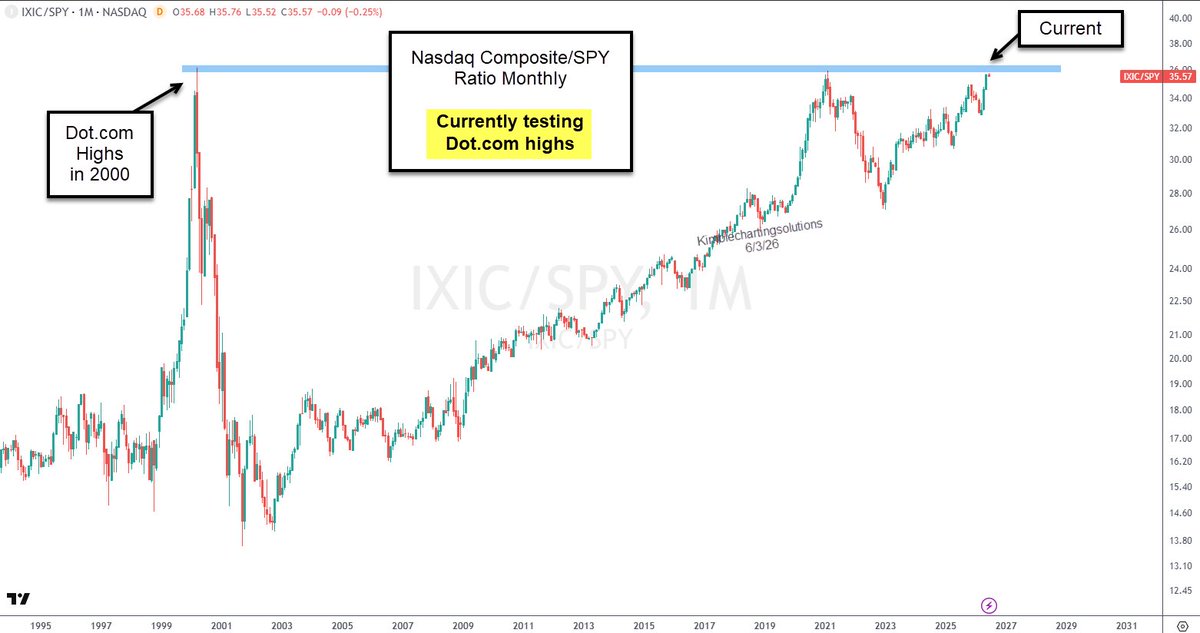
The Nasdaq Composite (IXIC) relative to the S&P 500 Index (SPX) is once again testing its dot-com bubble highs.
The ratio first ran into this resistance level in early 2021, and peaked months before the broader market reached its cycle high, highlighting its importance as a leadership gauge.
While technology has already led on a strong basis in recent years, a decisive breakout above these multi-decade highs would suggest tech leadership to persist well into the future.
The Takeaway: A secular breakout in the Nasdaq versus the S&P 500 would point to continued Tech leadership ahead.
More Great Charts
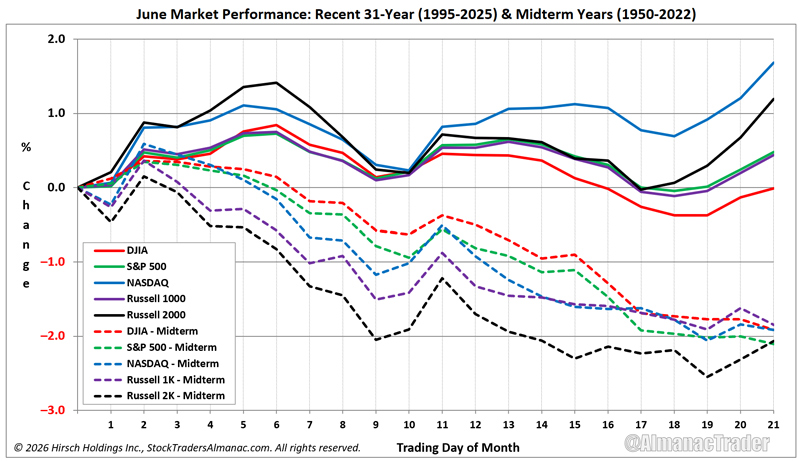
Recent gains are facing off against one of the market's more challenging seasonal periods.
Read the full analysis from Jeff Hirsch.
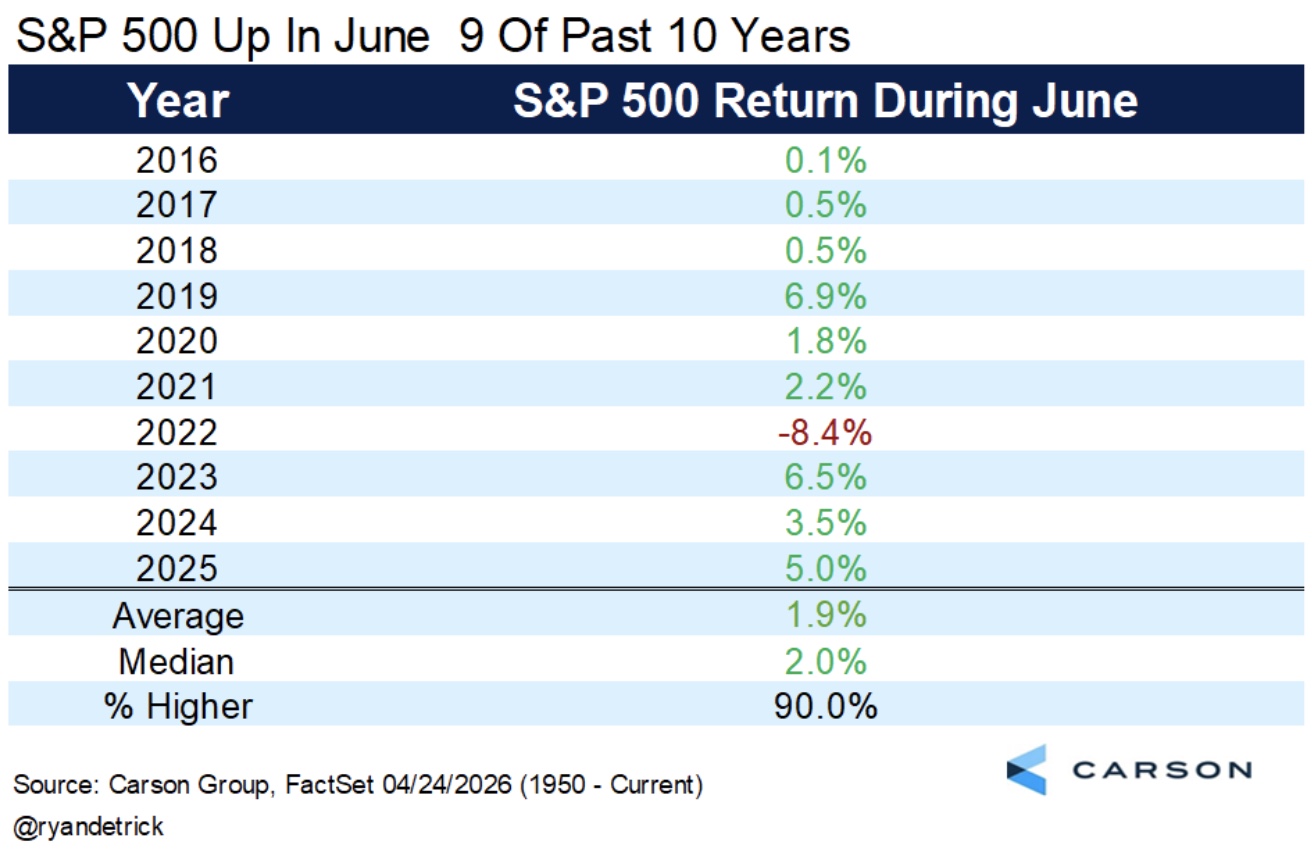
Over the last decade, June has delivered positive returns for the S&P 500 in nine out of ten years.
Check out the complete article from Ryan Detrick.
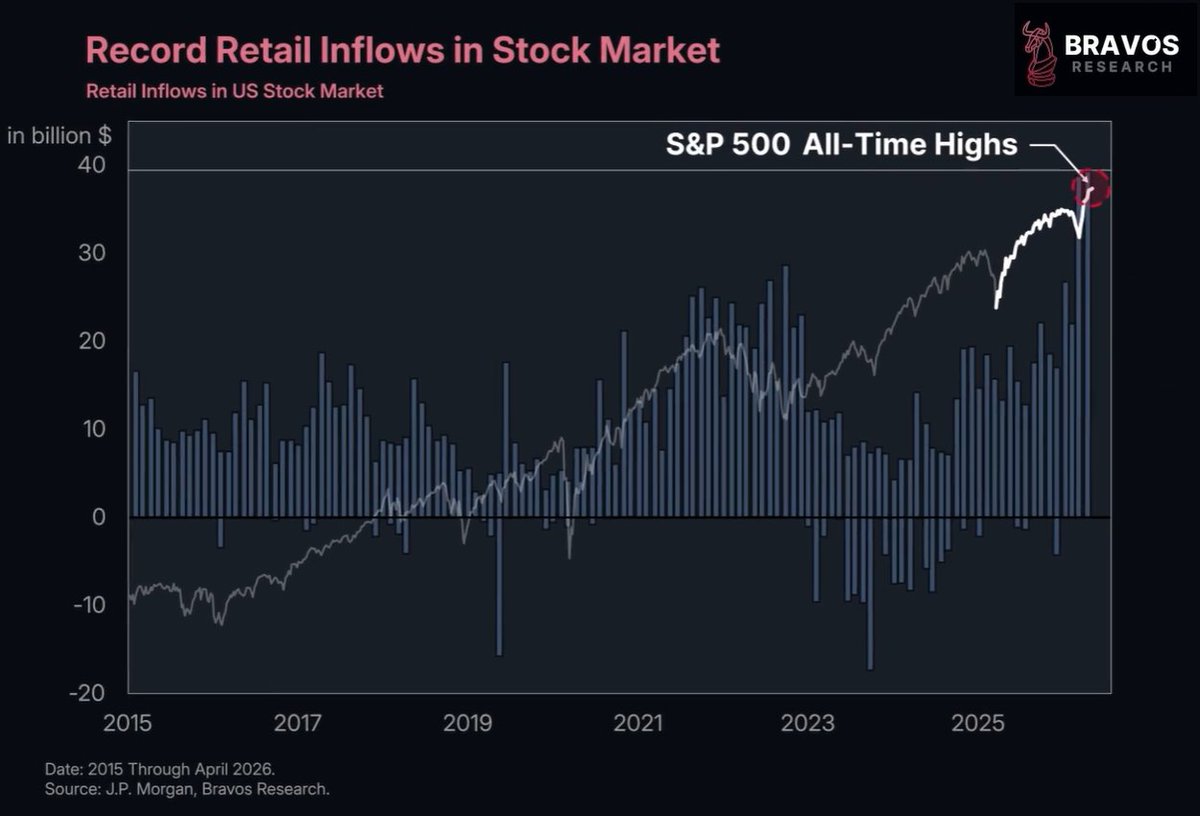
Retail investors bought a record $80 billion of stocks in the past two months.
Explore the entire thread from Bravos Research.
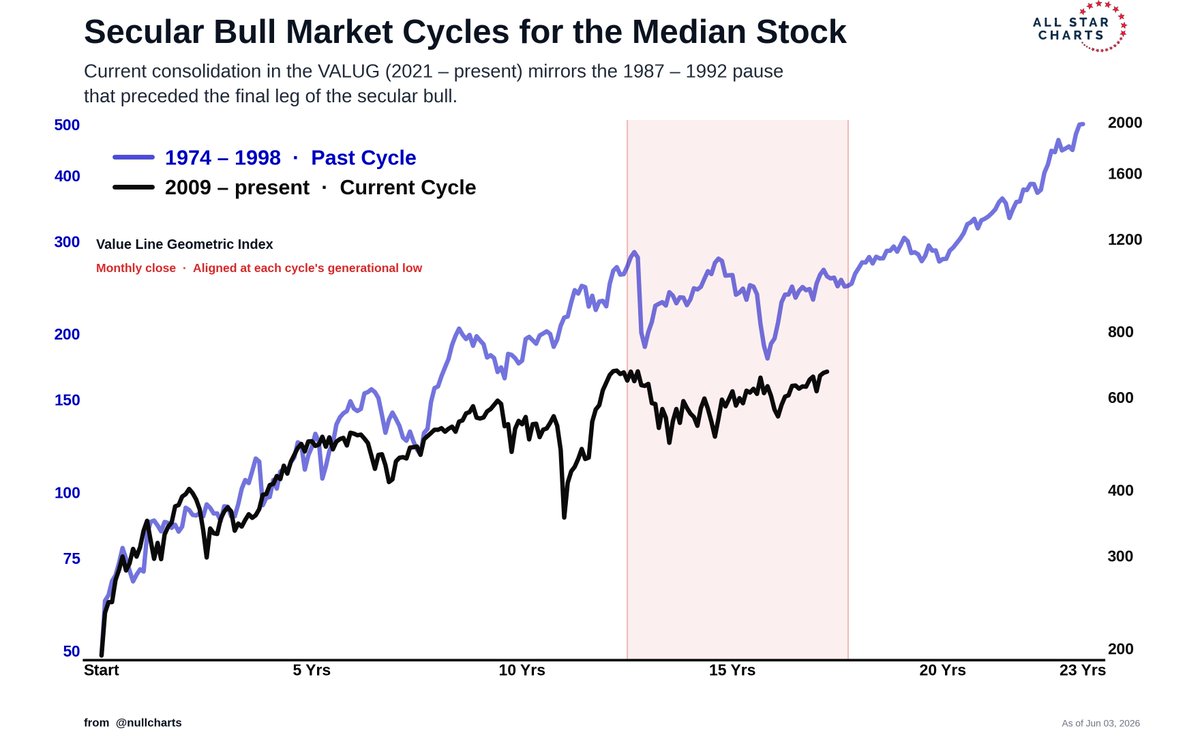
The median US stock has gone nowhere for over 4 years.
Compared with the secular bull market that started in 1974, today's consolidation closely resembles the 1987-1992 period.
View the whole tweet from Ricardo Sarraf.
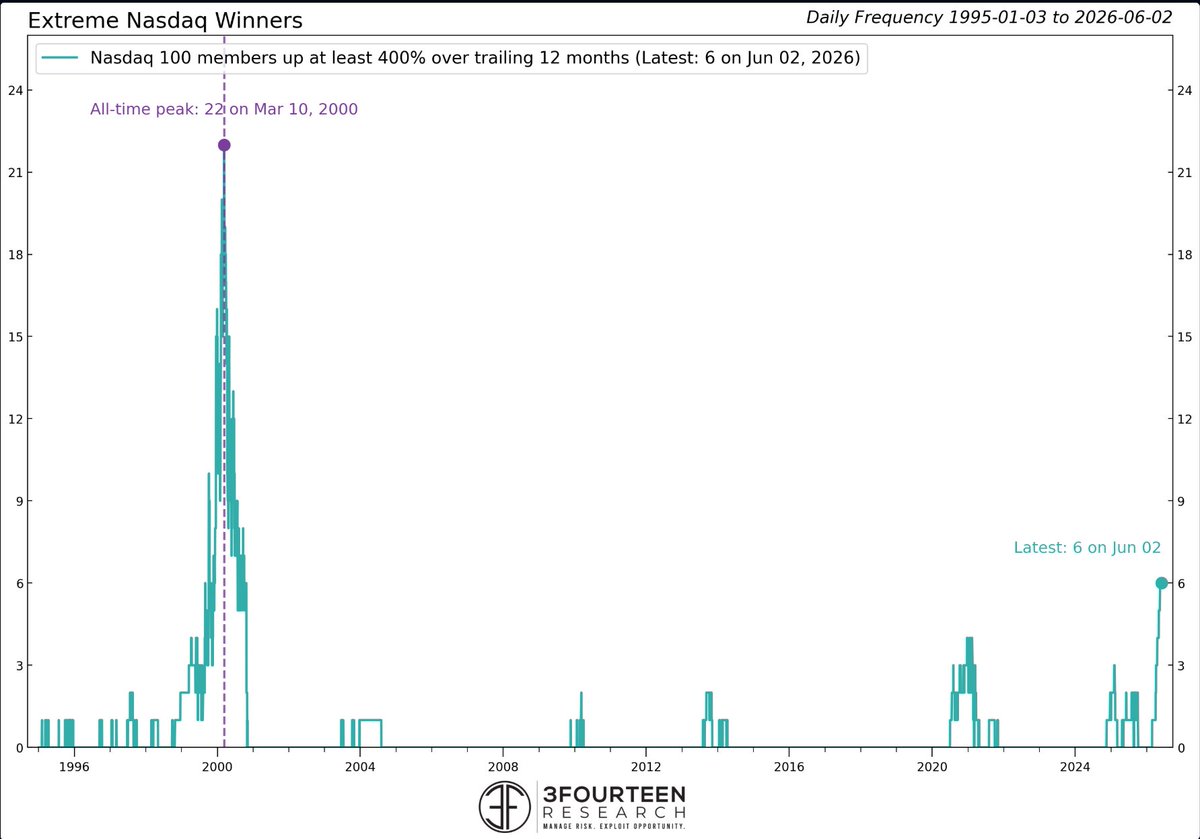
The Nasdaq is producing the most outsized winners since the Tech Bubble, but current conditions remain far less euphoric.
See the full post from Warren Pies.
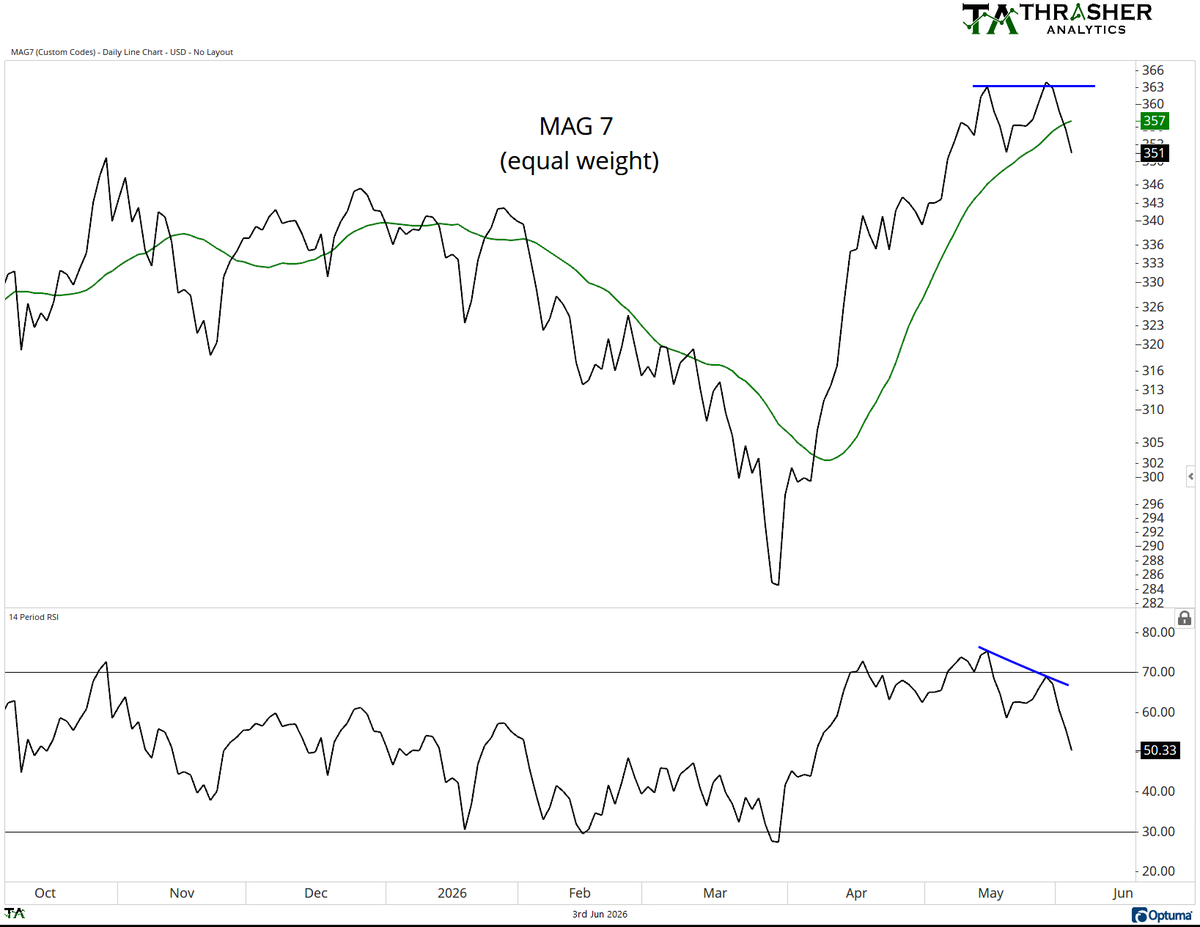
An equal-weighted basket of the Mag 7 has broken back below its 20-day moving average following a failed breakout and bearish momentum divergence.
Examine the entire tweet from Andrew Thrasher.
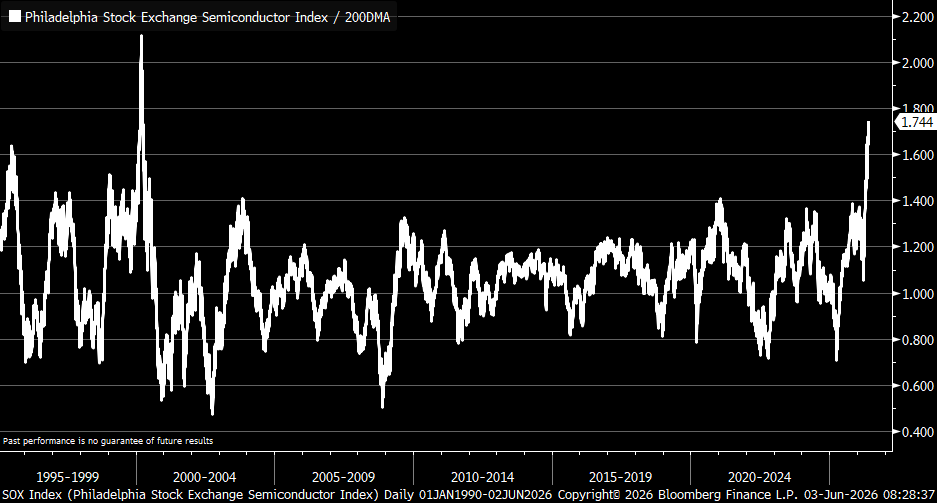
The Philadelphia Semiconductor Index is trading its furthest above the 200-day moving average since March 2000.
View the complete post from Kevin Gordon.
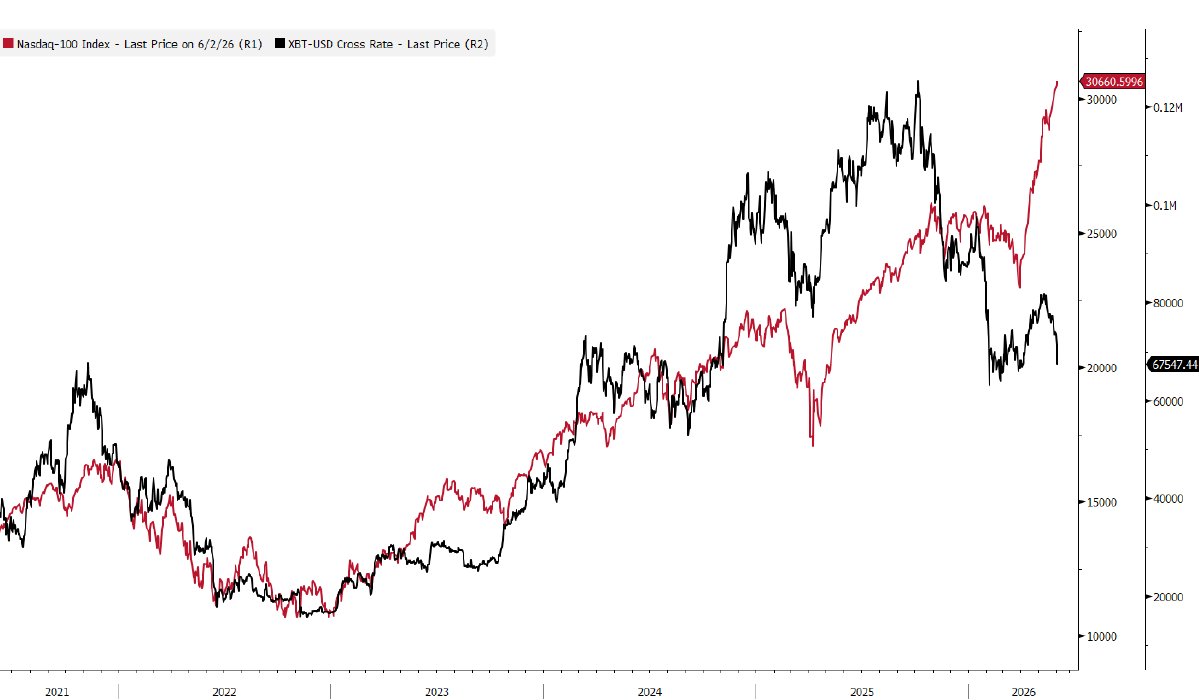
While the Nasdaq has went on to print new highs, Bitcoin has remained in a roughly -45% drawdown.
Check out the full tweet from RenMac.
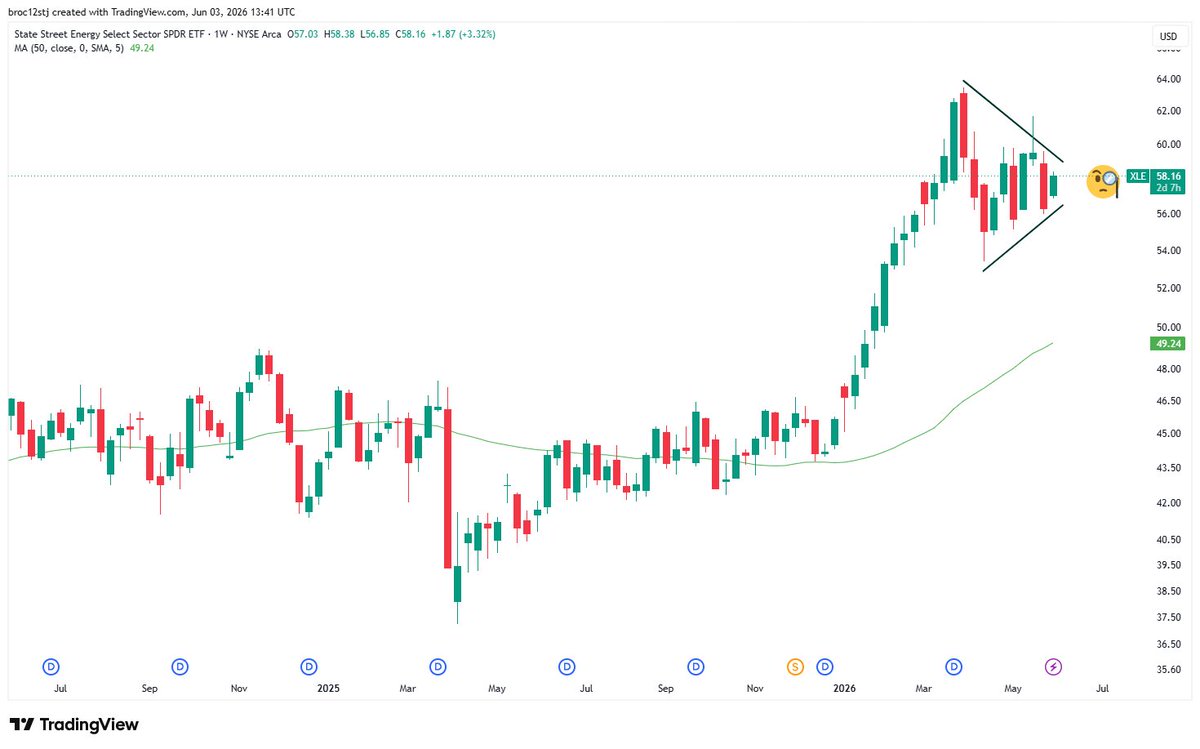
The Energy sector has spent several weeks coiling following its powerful rally.
See the whole post from Broc Losing.
The Chart Report curates best-in-class technical analysis from across the web.
If you’d like to share a chart or just say hello, email us at [email protected]