Semis Need South Korea to Hold 🇰🇷 The Chart Report

Chart of the Day
🏆 Today's Chart of the Day was shared by Daniel Puleo.
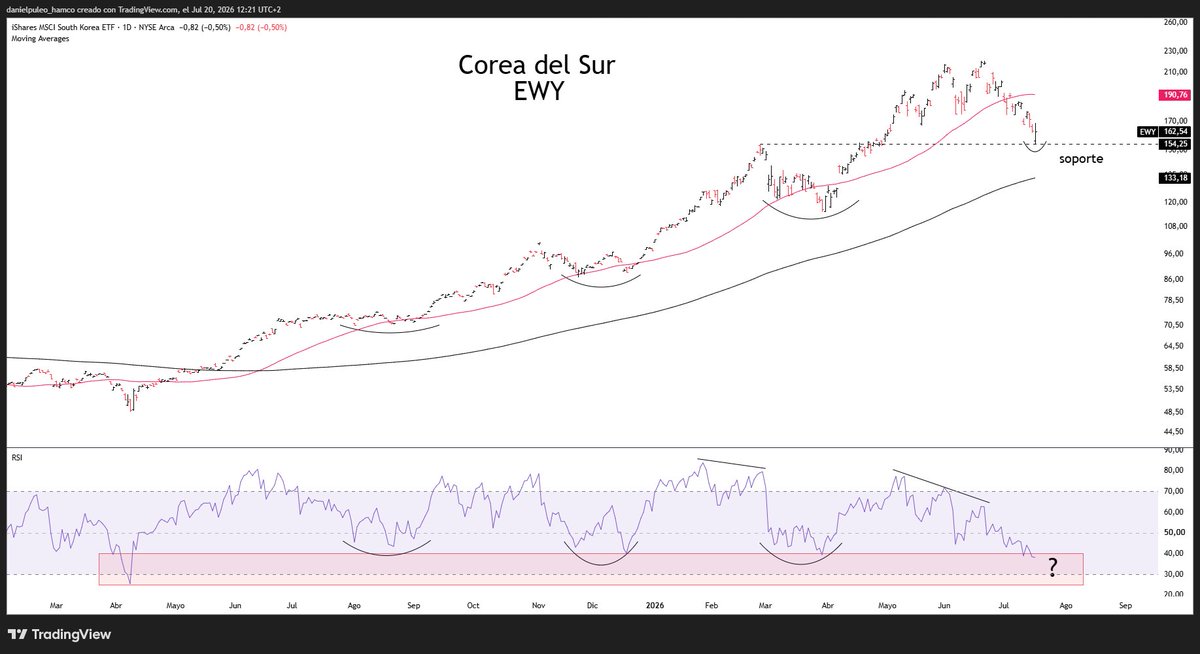
The South Korea KOSPI has emerged as one of the most important global indexes, given its significant semiconductor and memory exposure tied to the broader AI trade.
The South Korea ETF (EWY) is now retesting its Q1 highs and attempting to turn former resistance into support, while RSI has fallen below 40 for the first time since the 2025 uptrend began.
A failure to hold this level could signal further weakness for semiconductors, unless U.S. equities can successfully decouple from KOSPI volatility.
The Takeaway: EWY’s next move may determine whether the recent weakness in semis is a temporary pause or the beginning of a deeper correction.
More Great Charts
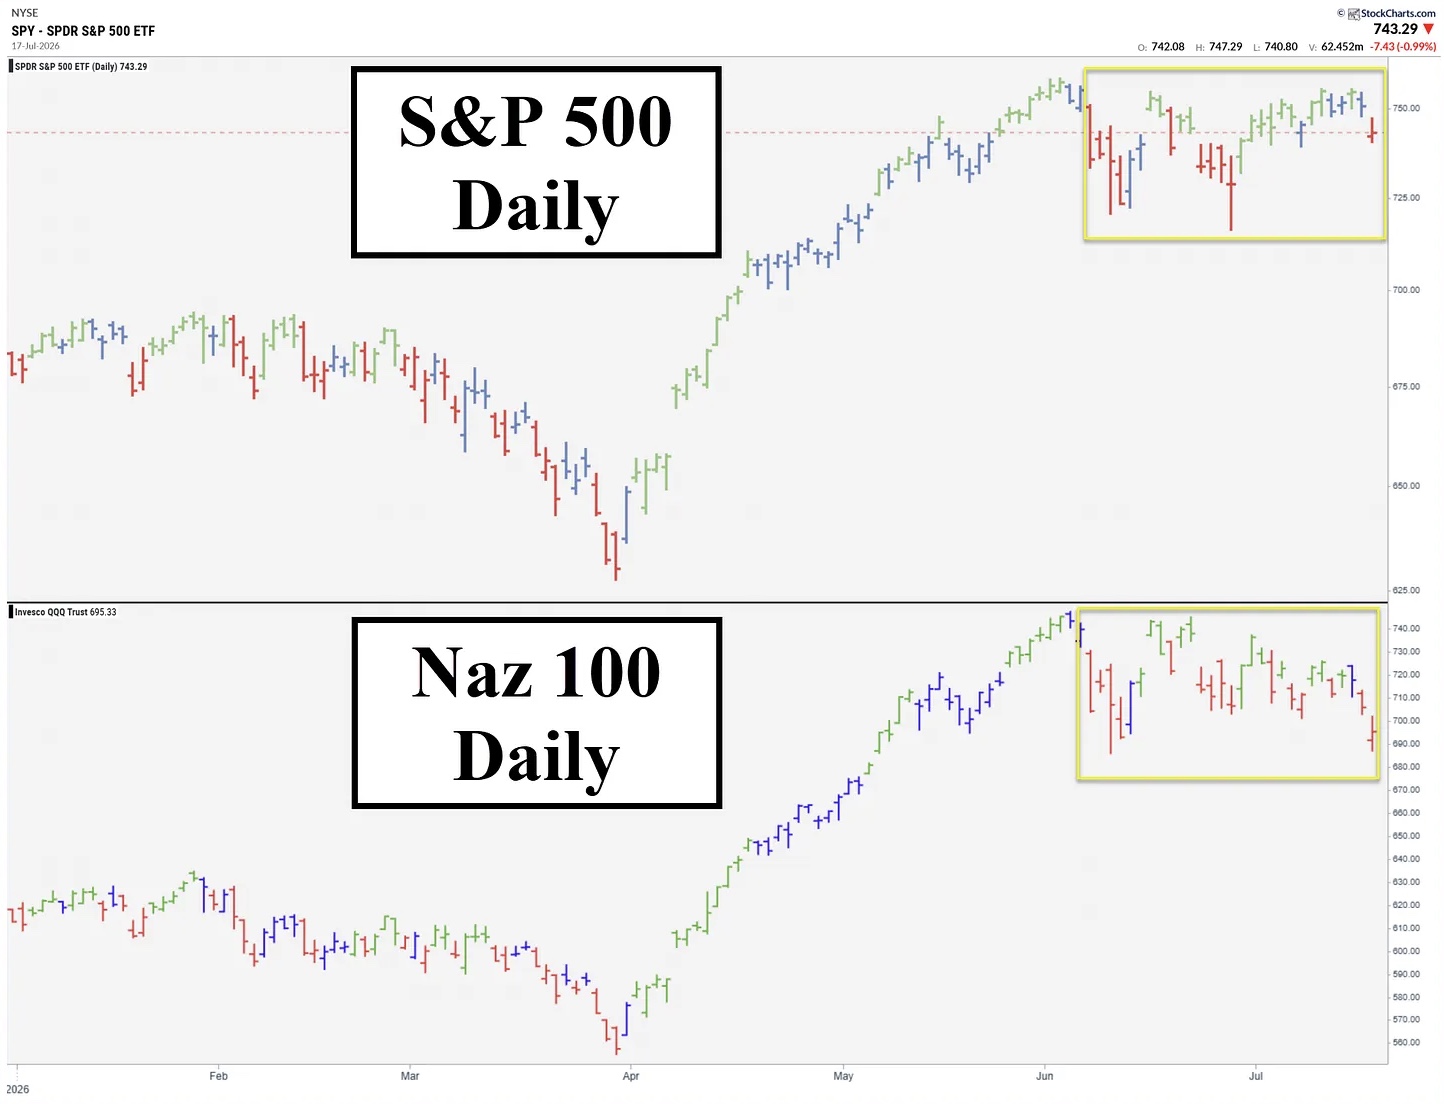
The S&P 500 and Nasdaq 100 remain confined to their respective trading ranges.
Check out the latest article from Jim Carroll.
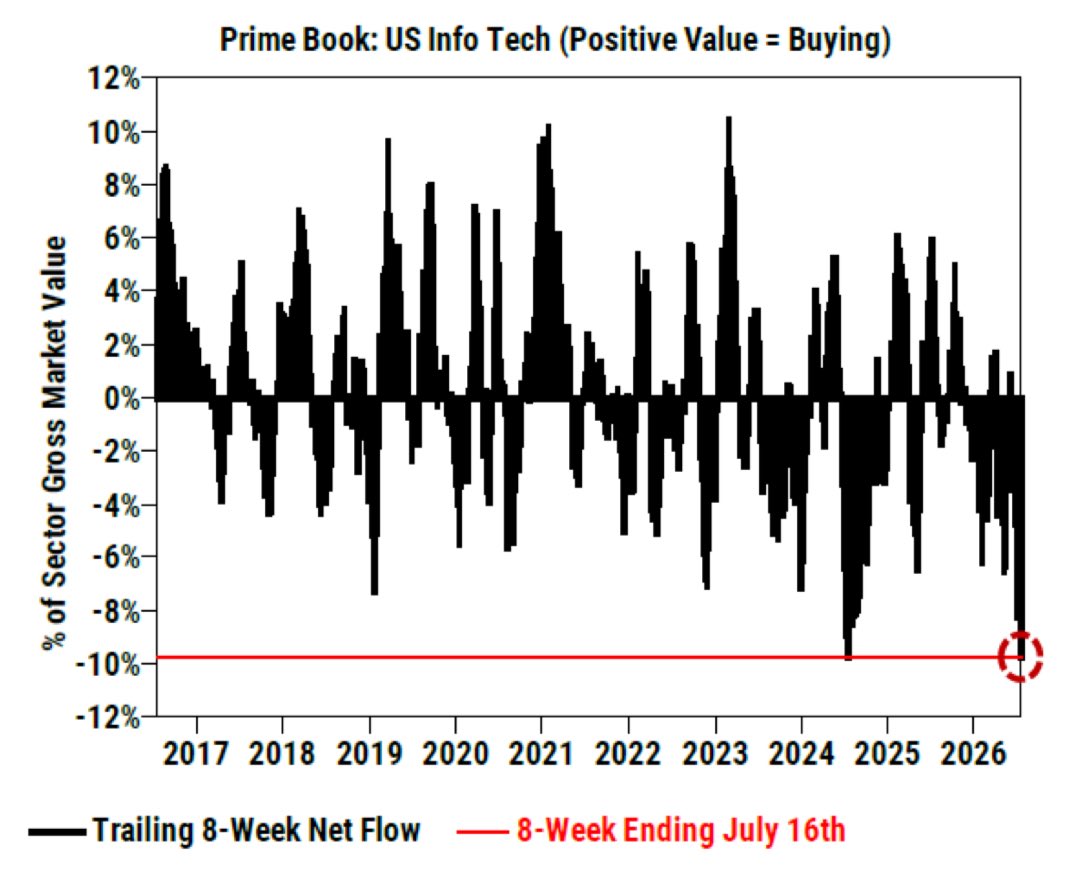
Hedge funds have sold Tech stocks at a record pace over the past eight weeks.
View the whole tweet from David Marlin.
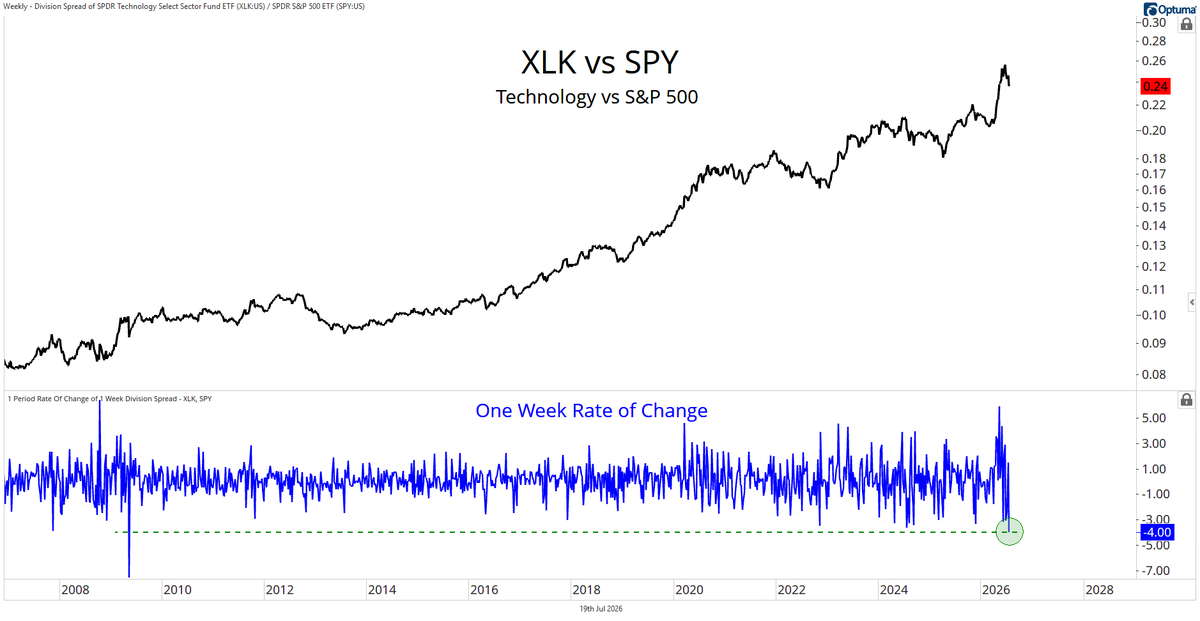
Technology just had its worst week relative to the S&P 500 since 2009.
See the complete post from Dylan Tanen.
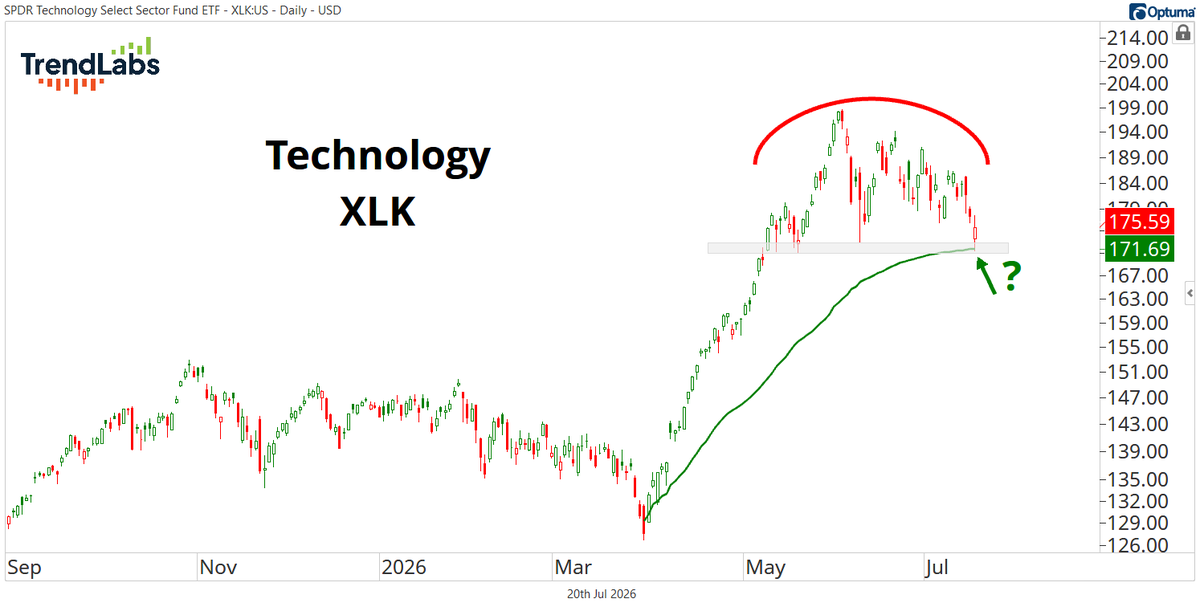
The Technology Sector ETF is testing a confluence of support at the $170 level.
Examine the entire tweet from Sam Gatlin.
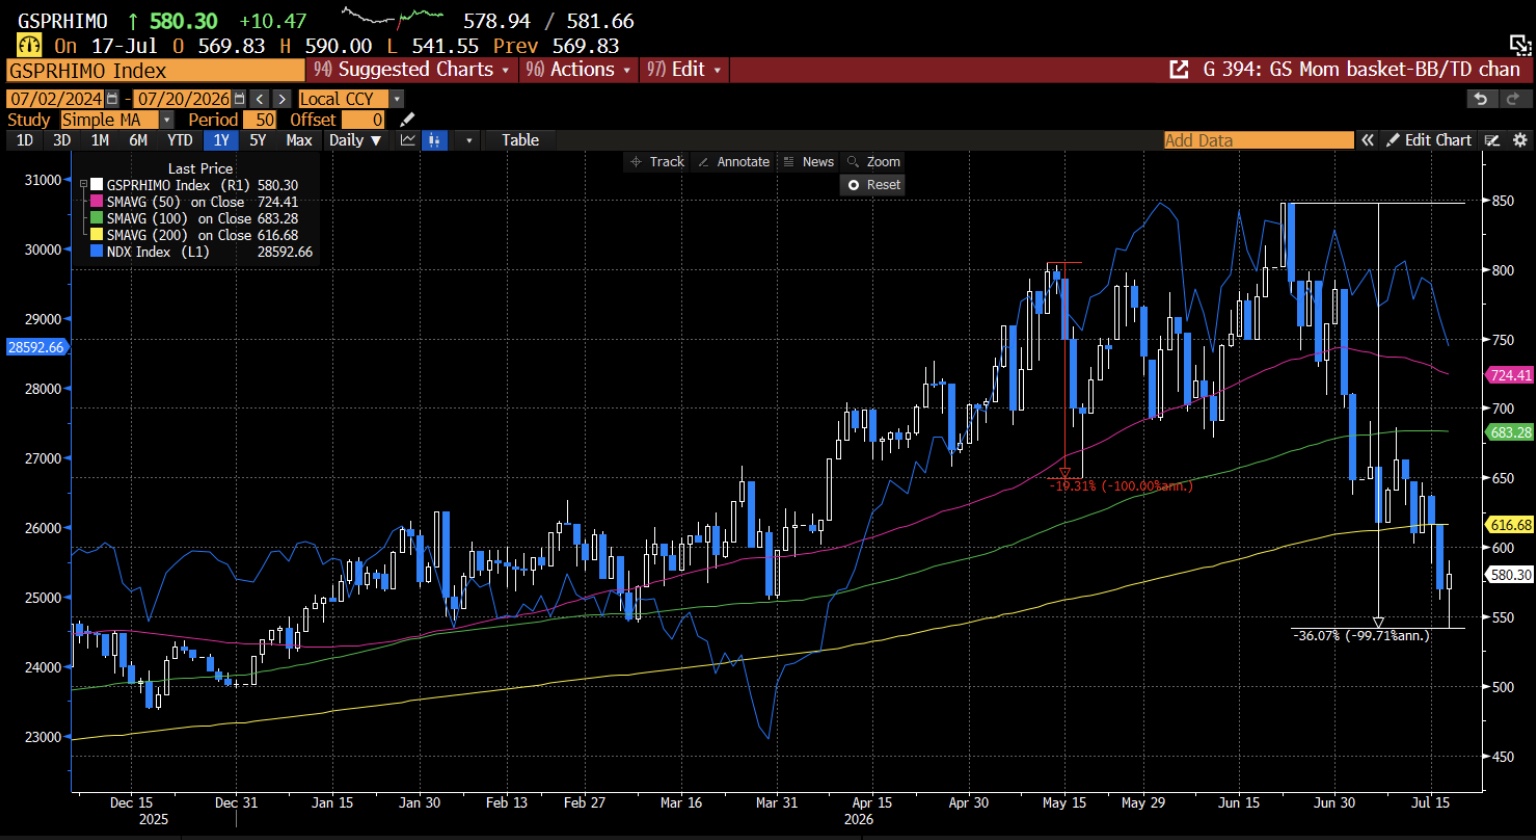
The Goldman Sachs Momentum Basket dropped 36% from its June peak, marking the worst momentum-factor drawdown in nearly two decades.
Read the full research note from CoiledSpringCapital.
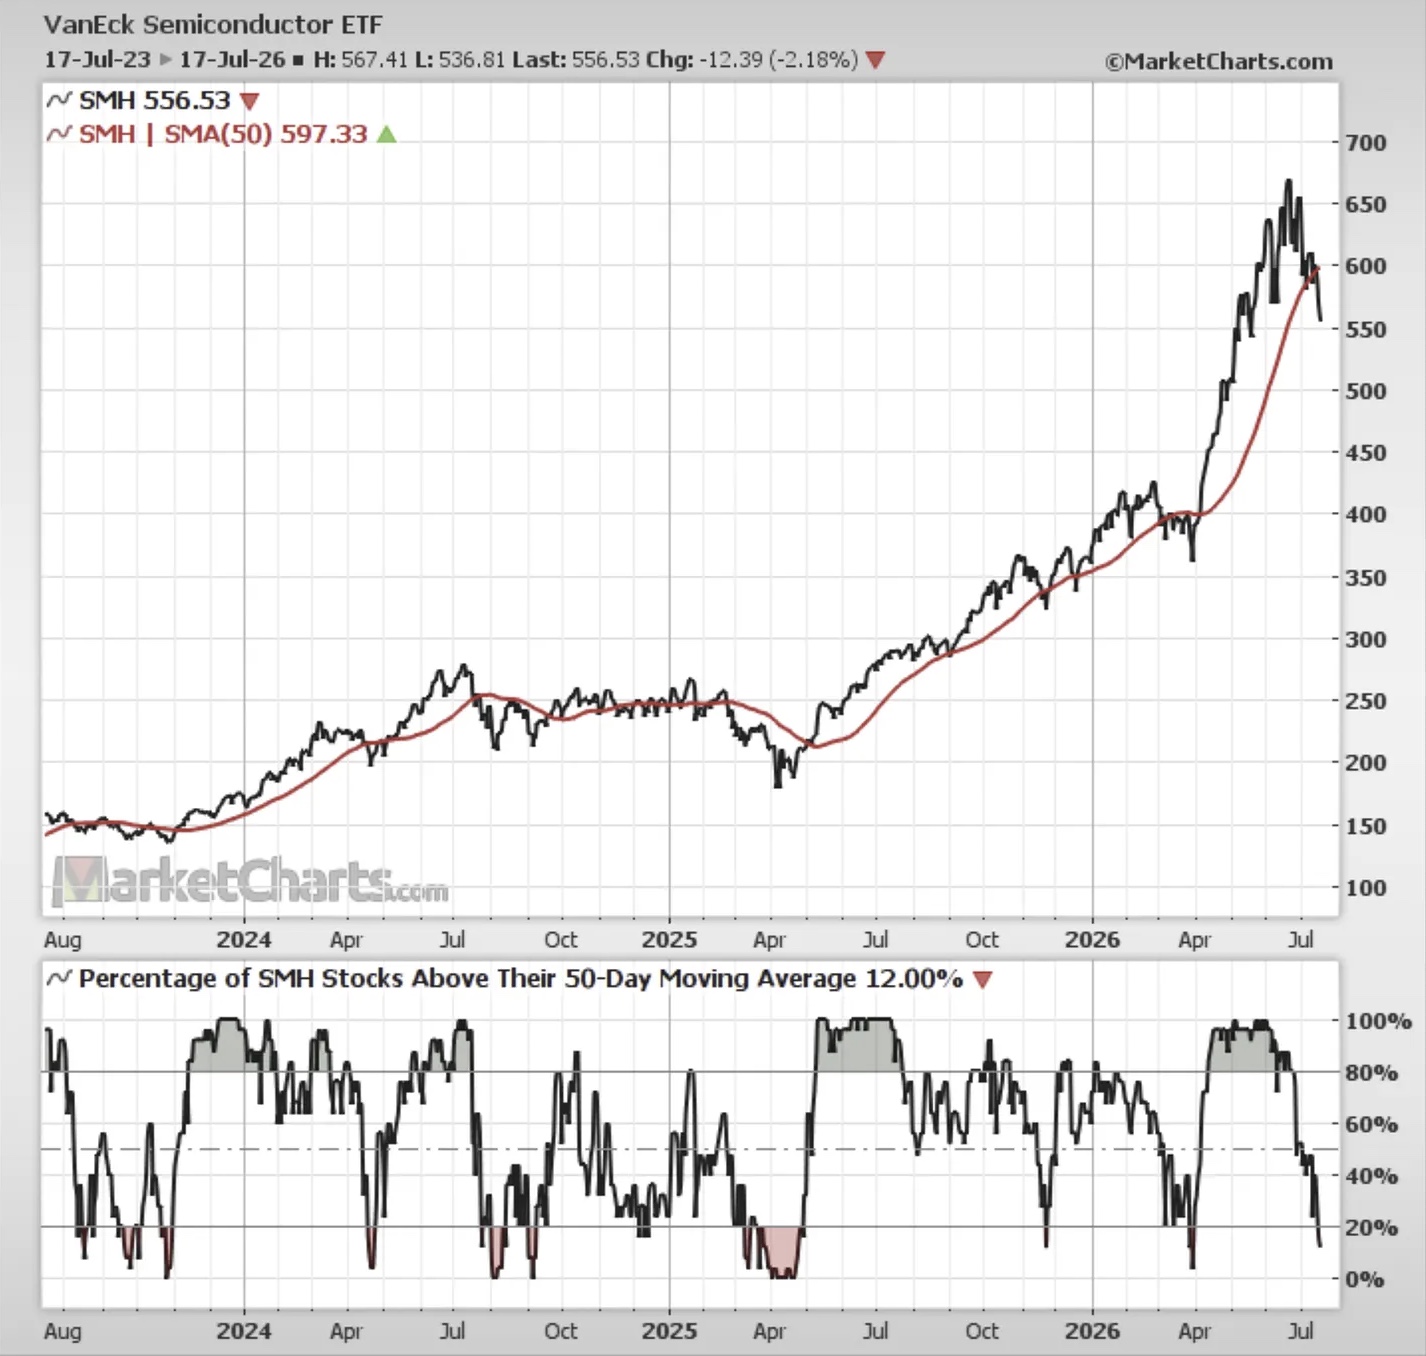
Less than 20% of Semiconductor stocks are trading above their 50-day moving averages, highlighting a notable reset in the space.
Check out the whole article from Callum Thomas.
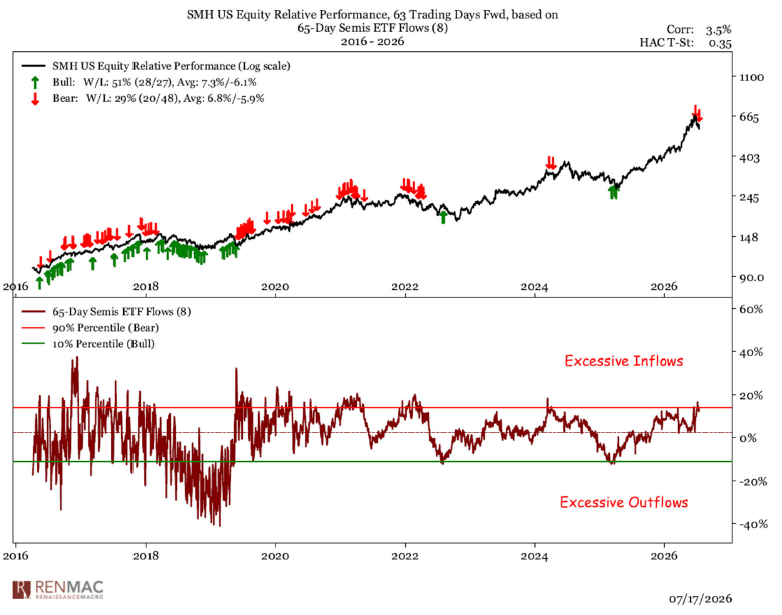
Investor flows into Semiconductors remain elevated despite the recent selloff, the opposite of what is typically seen near major market bottoms, where fear tends to outweigh greed.
See the complete post from RenMac.
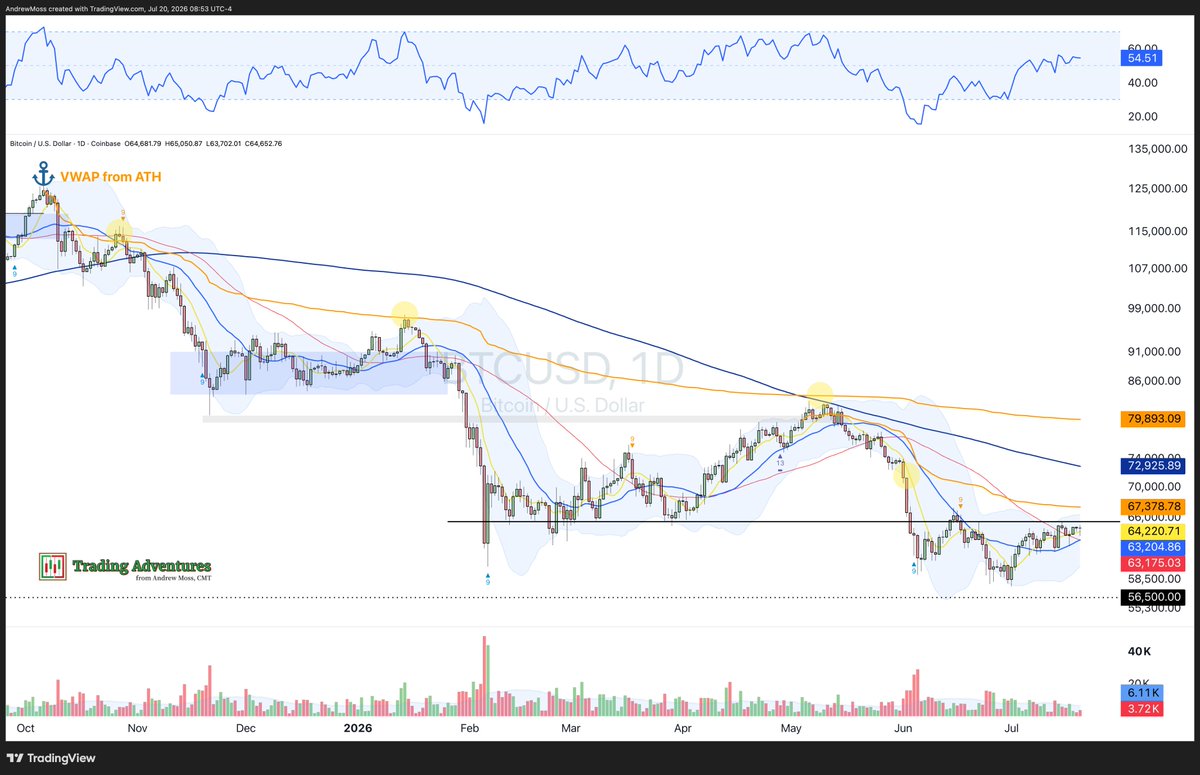
Bitcoin has formed a potential inverse head-and-shoulders pattern as it attempts to reclaim the $65,000 level.
Watch the full analysis from Andrew Moss.
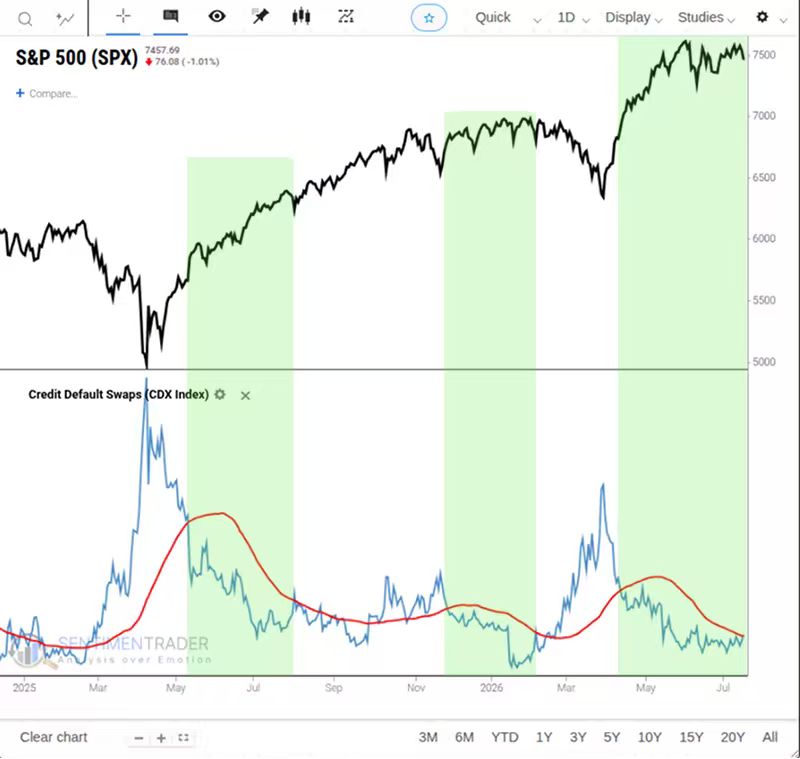
Credit default swaps have moved back above their 50-day moving average, a historically bearish signal for stocks.
Examine the entire tweet from Sentiment Trader.
The Chart Report curates best-in-class technical analysis from across the web.
If you’d like to share a chart or just say hello, email us at [email protected]