A Critical Inflection Point for the Nasdaq 📉 The Chart Report

Chart of the Day
🏆 Today's Chart of the Day was shared by Jake Wujastyk.
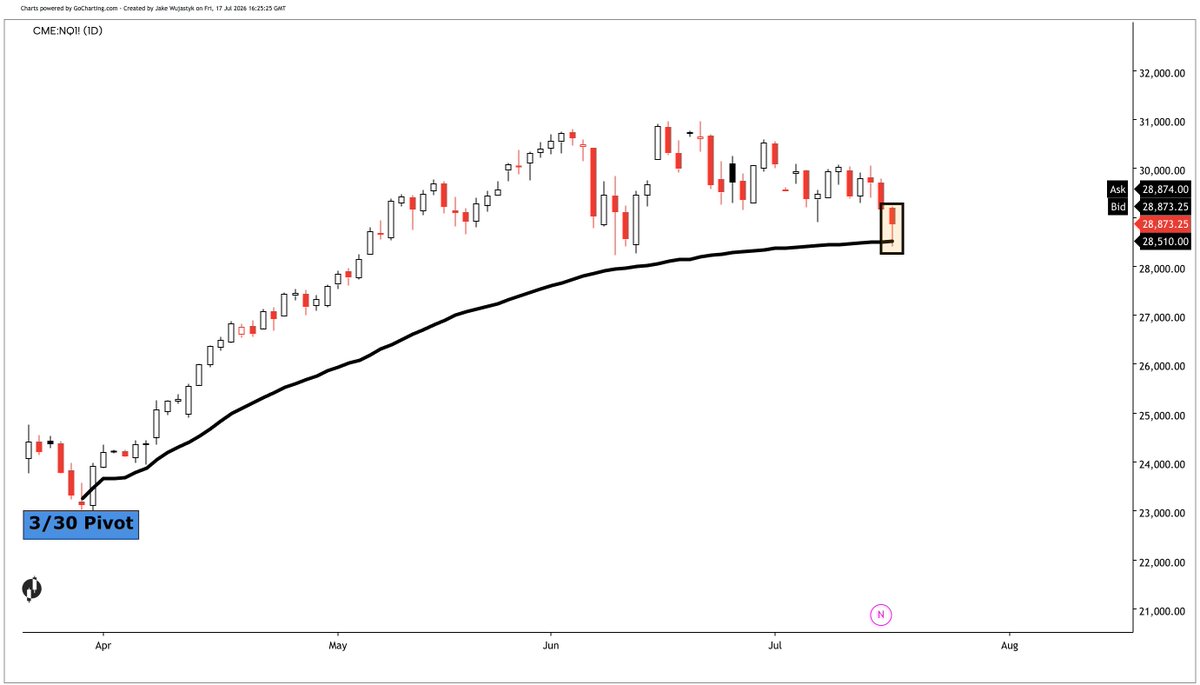
After nearly two and a half months of choppy price action, Nasdaq futures have pulled back to the anchored VWAP from the March 30 pivot low, a level that marks the average cost basis of buyers since the bottom.
The index rallied over 2% from its early morning lows before fading to close the day down -1.5%, but still managed to finish the session above this key threshold.
That VWAP also aligns with the level where the Nasdaq found support in June near 28.5k, where a break below would increase the odds that an interim top is in place.
The Takeaway: The anchored VWAP from the March 30 lows can act as a major line in the sand for the Nasdaq 100.
More Great Charts
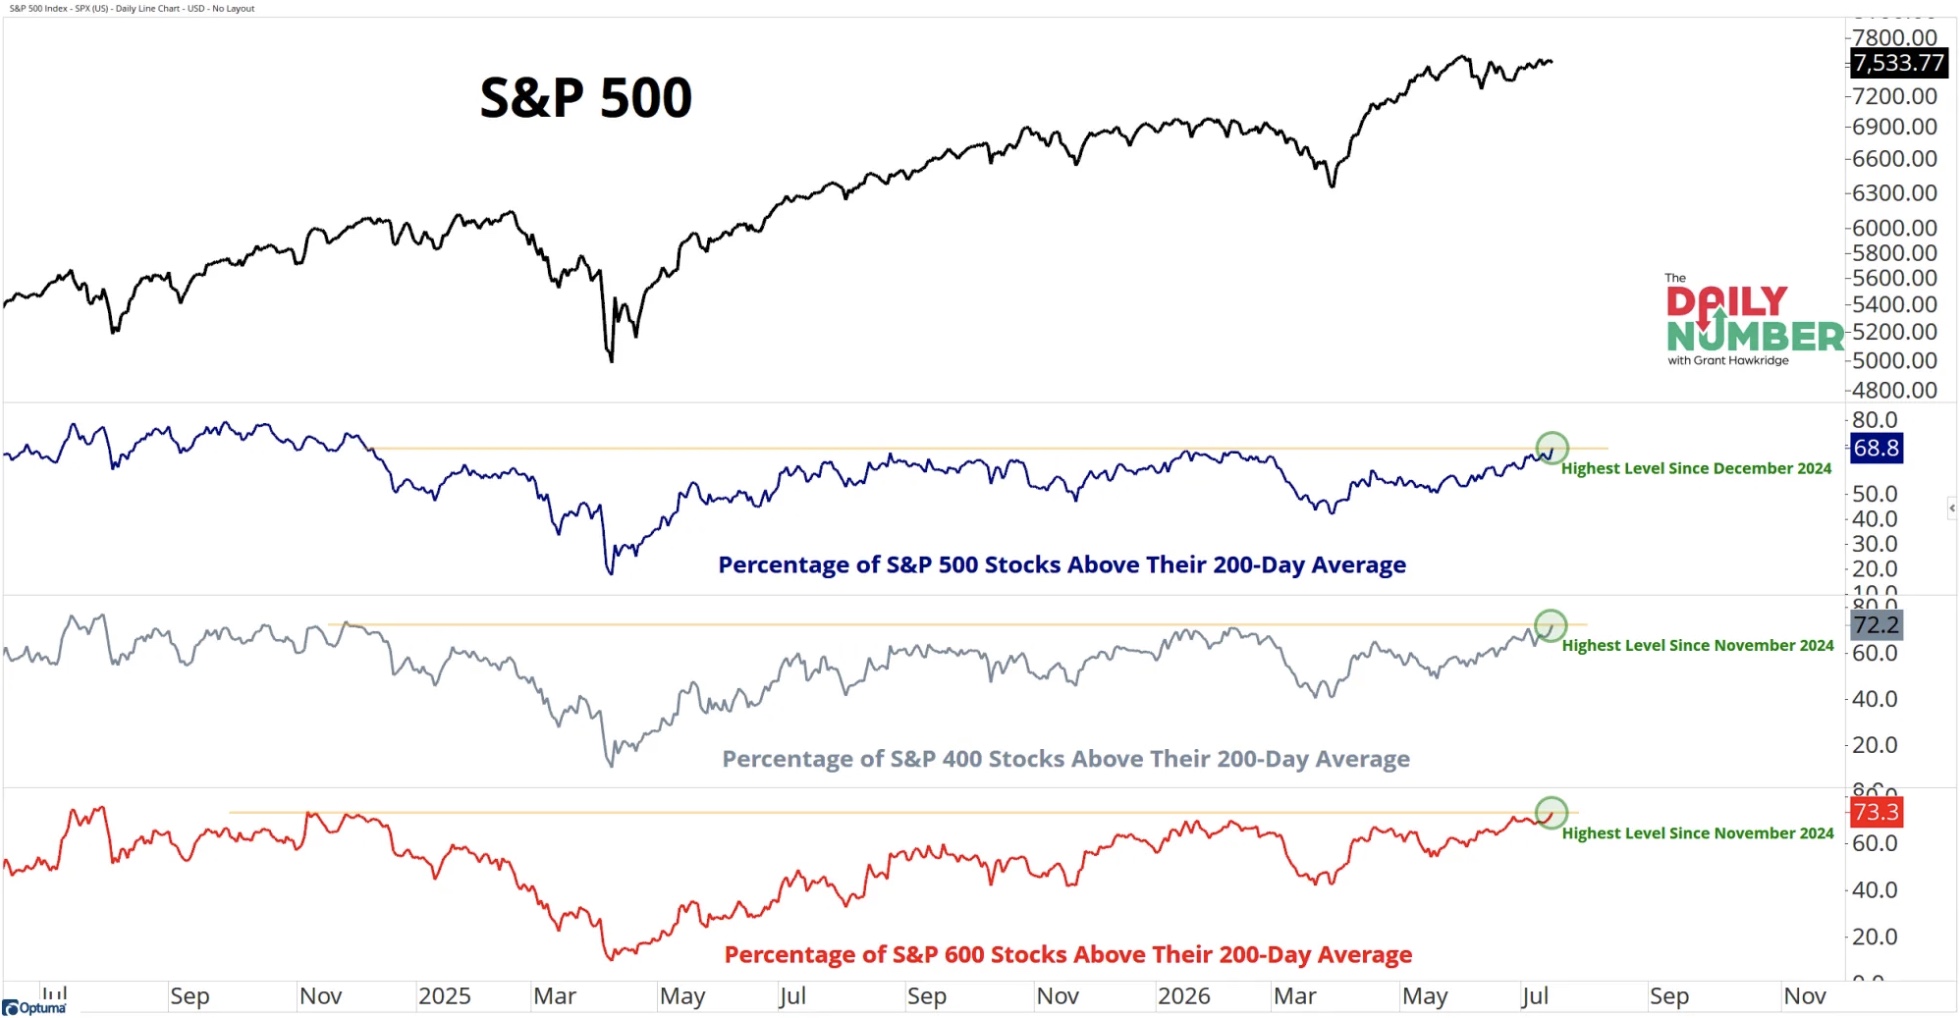
Roughly two-thirds of stocks across the S&P 500, S&P 400, and S&P 600 are now trading above their 200-day moving averages, the highest reading since Q4 2024.
Read the full analysis from Grant Hawkridge.
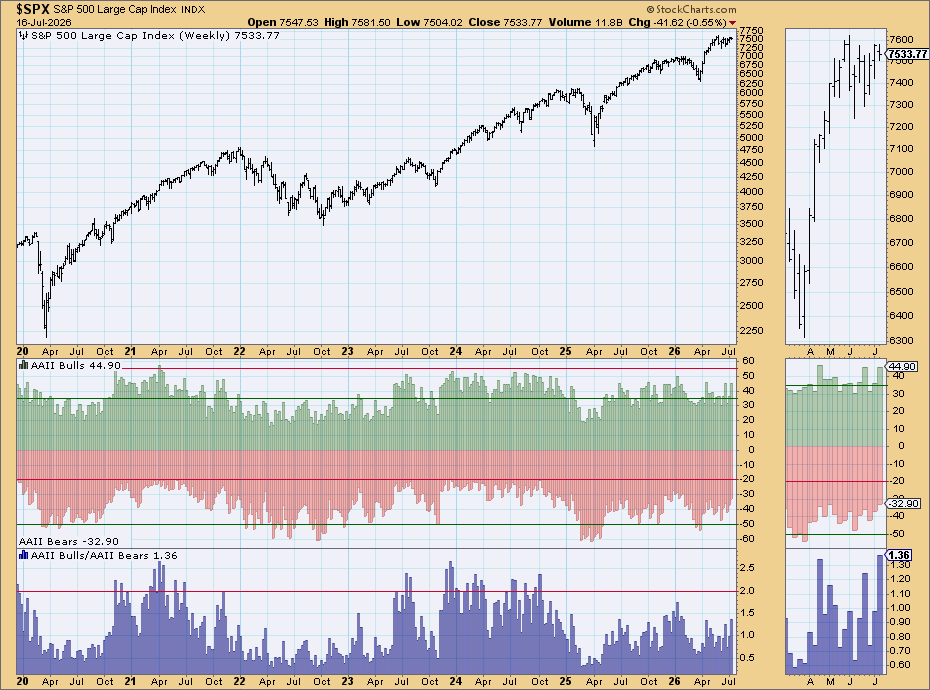
The latest AAII Bull-Bear Spread shows bulls outnumbering bears by the widest margin since January.
See the whole post from Linda Raschke.
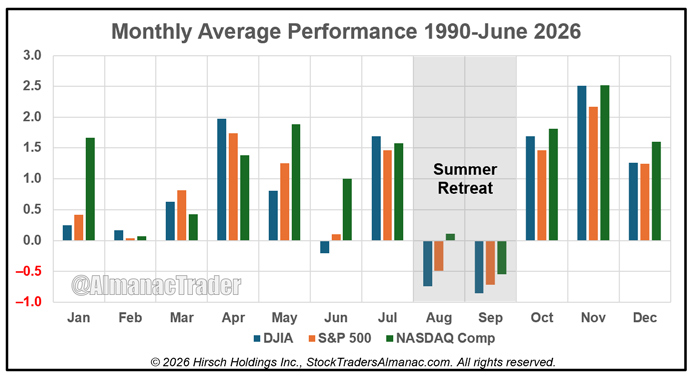
History suggests the market's most challenging seasonal stretch is just ahead, with August and September ranking as the weakest months of the year going back to 1990.
Check out the complete article from Jeff Hirsch.
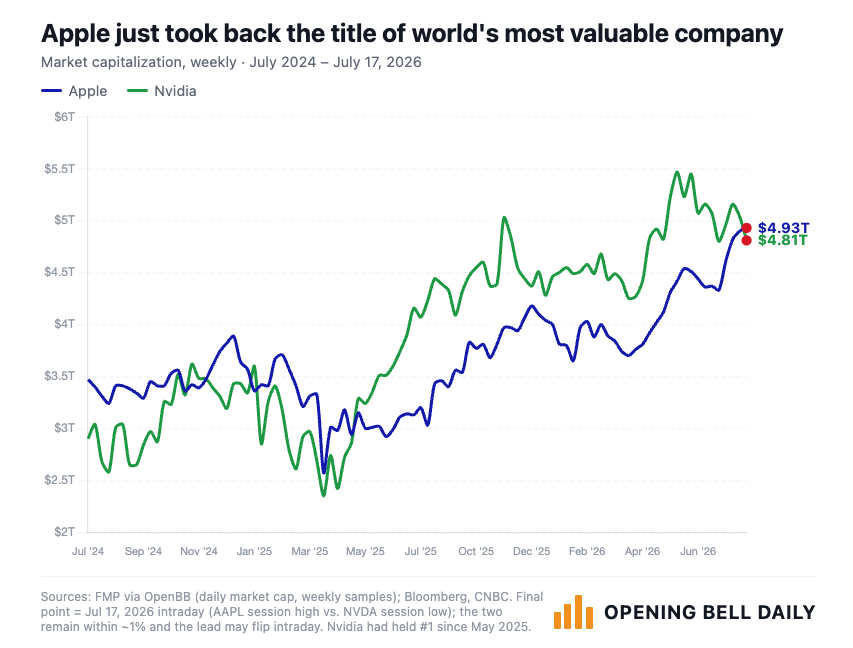
Apple has overtaken Nvidia and reclaimed the title of the world's largest company.
View the entire tweet from Phil Rosen.
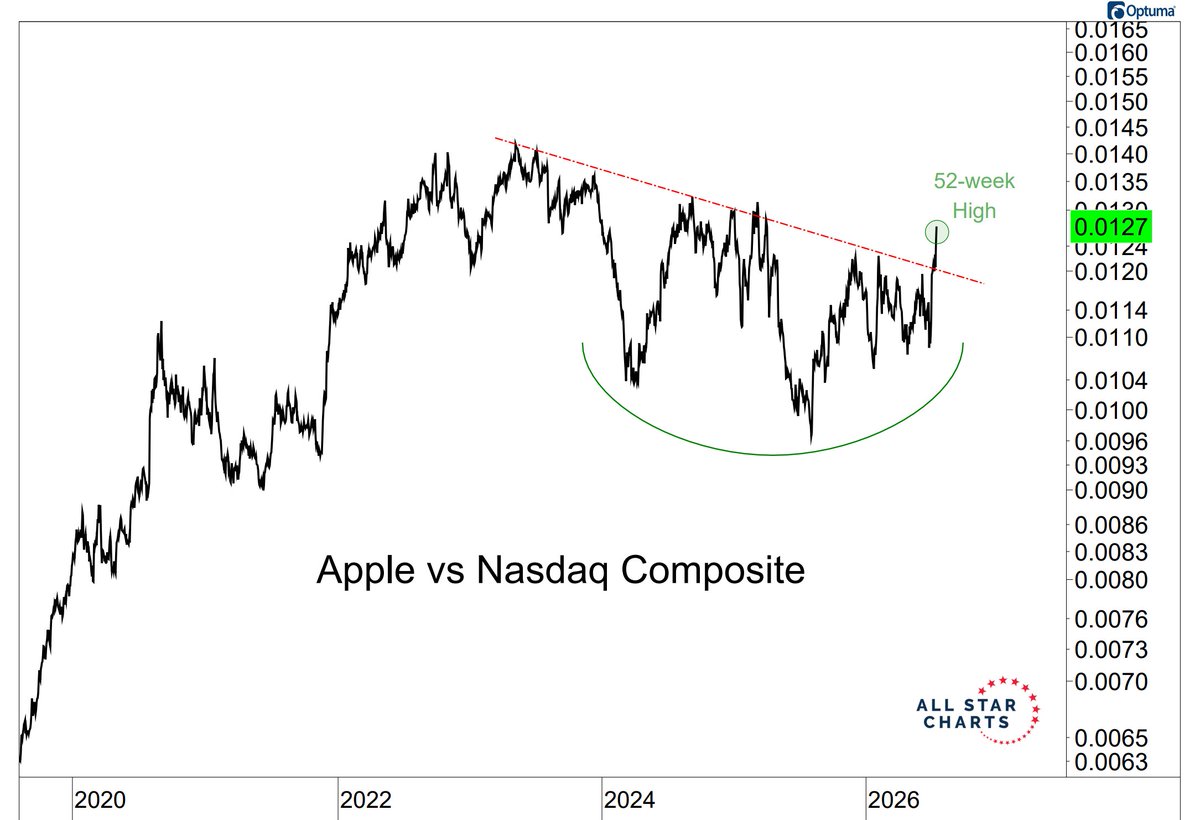
Apple is making new 52-week relative highs versus the Nasdaq after breaking out from a multi-year downtrend.
Examine the full post from Ricardo Sarraf.
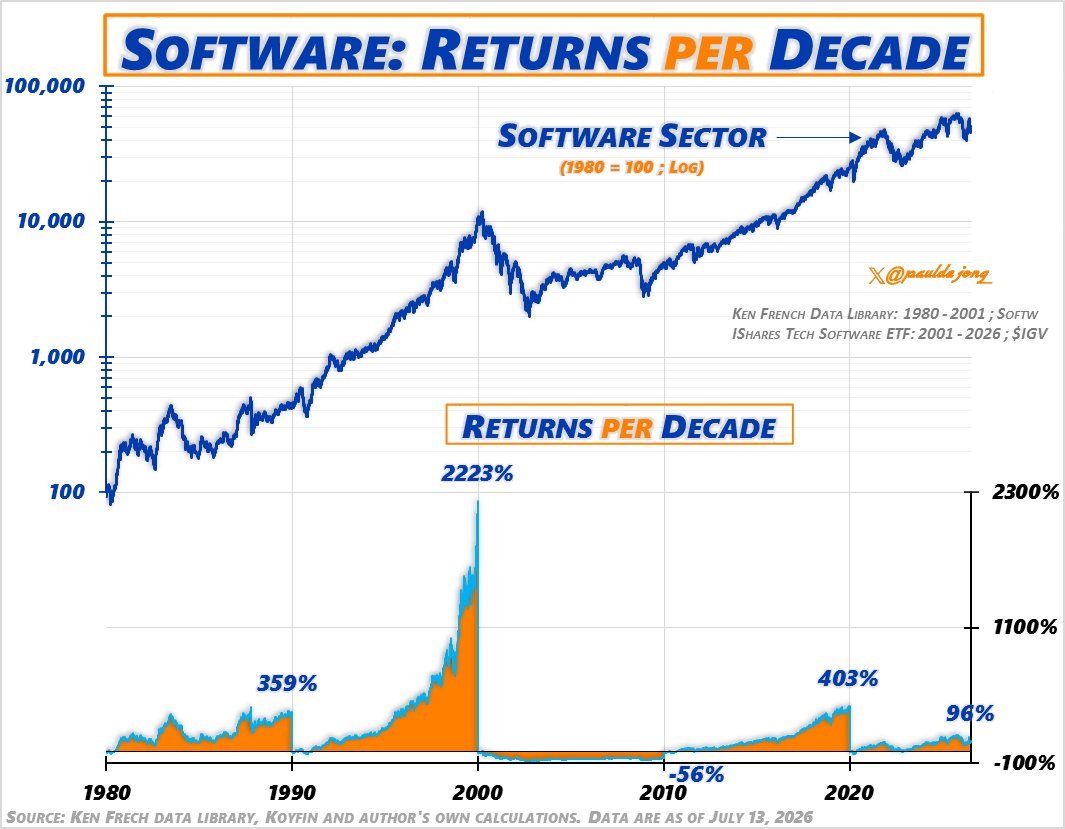
The AI-driven bull market has produced nowhere near the returns seen during the dot-com boom for software stocks.
See the whole tweet from Paul De Jong.
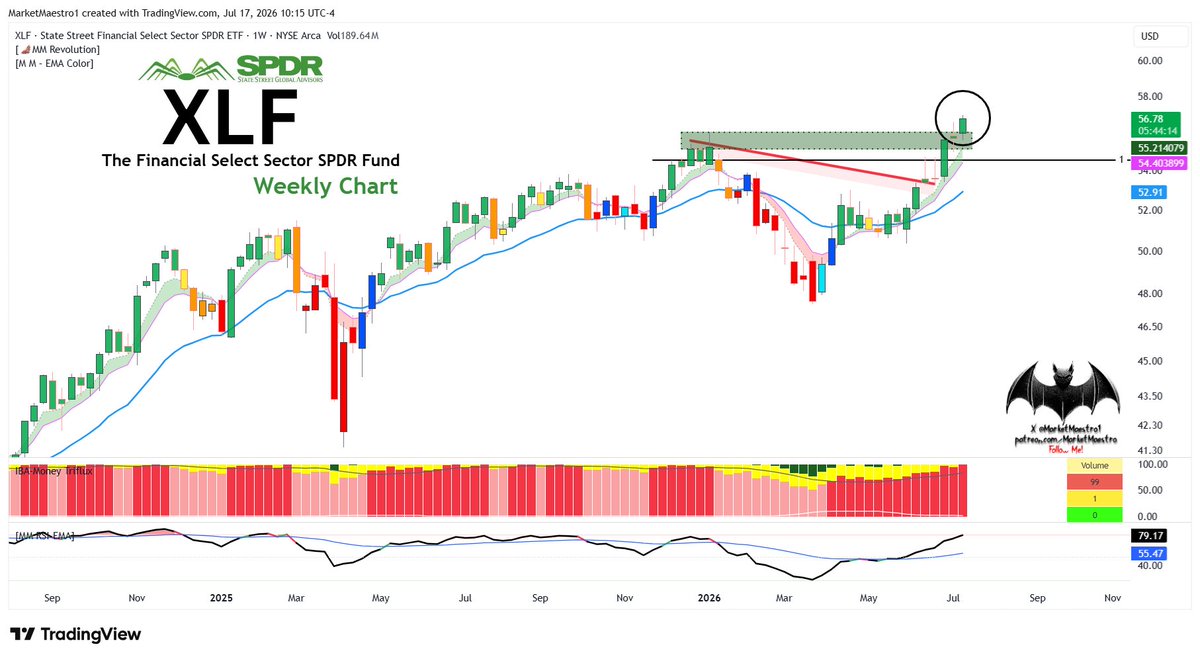
The Financial Sector ETF just recorded its highest weekly close on record.
View the complete post from Market Maestro.
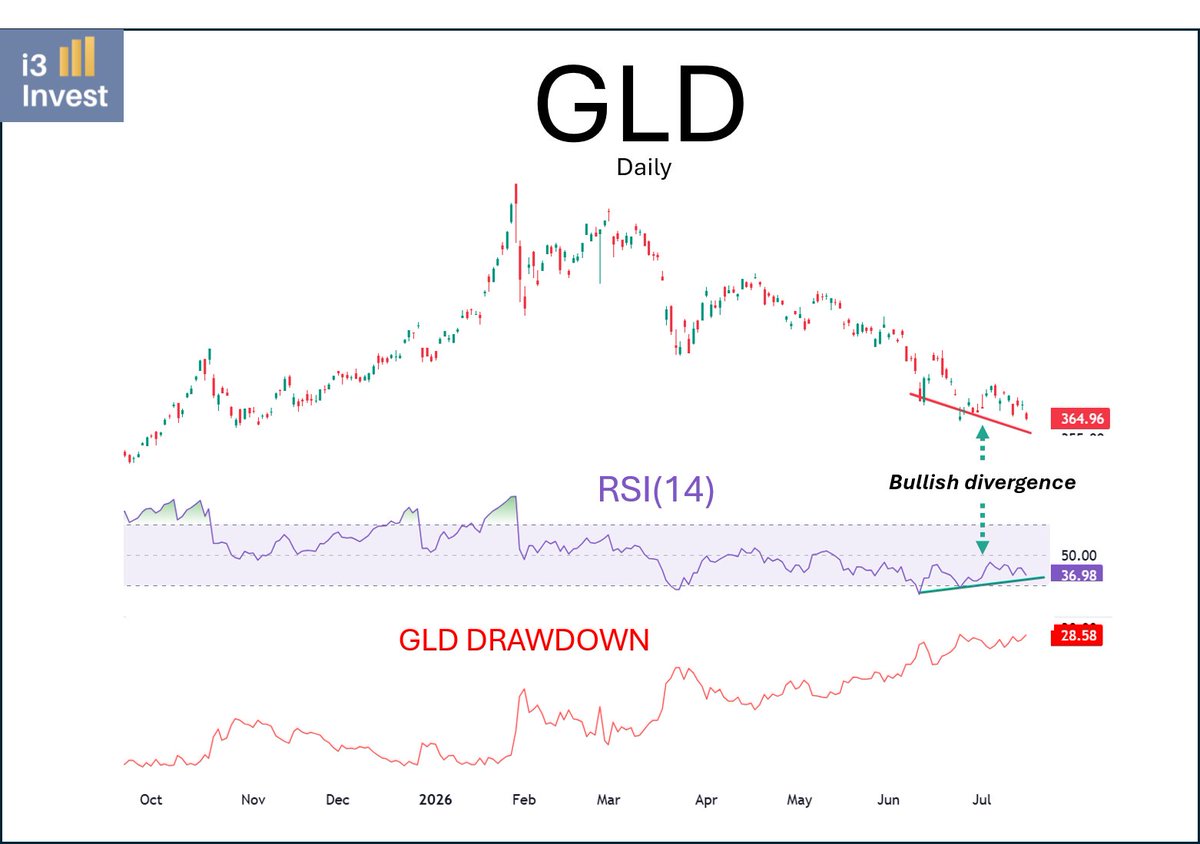
The Gold ETF is in its largest drawdown of the decade while showing a bullish RSI momentum divergence.
Check out the entire tweet from Guilherme Tavares.
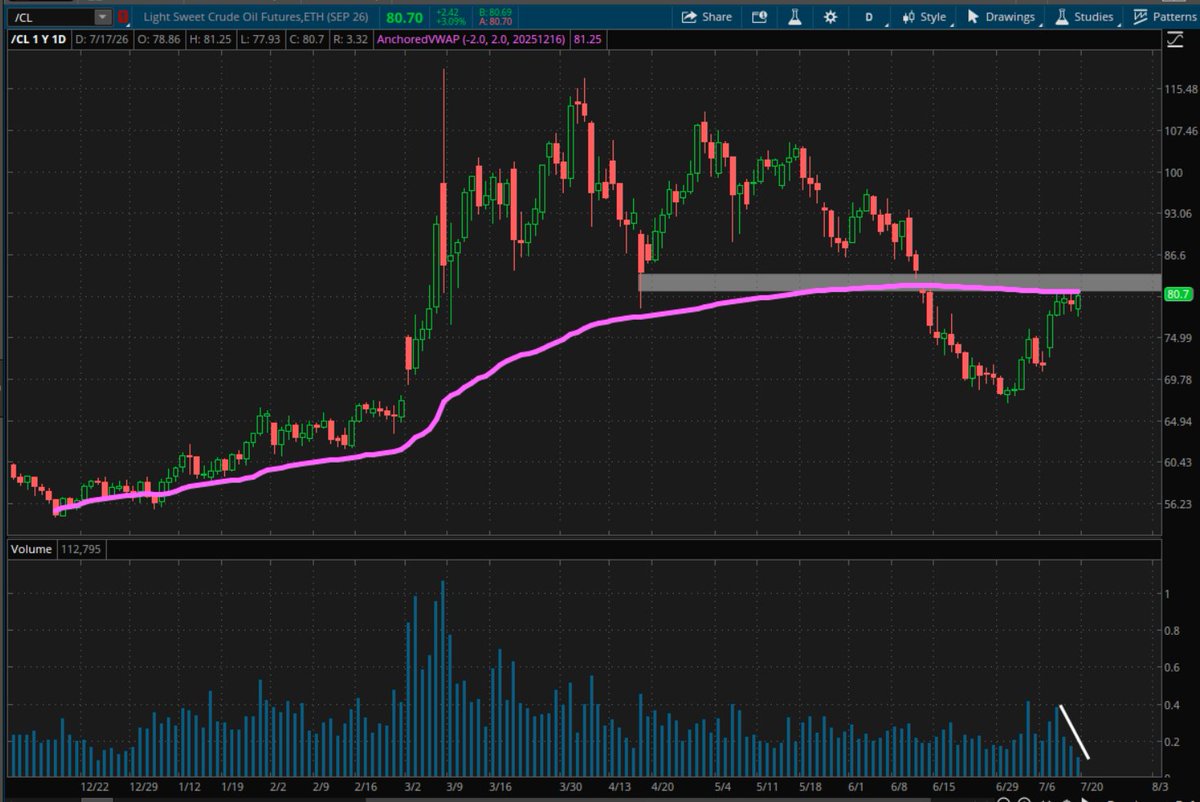
Crude Oil has pulled back to its former breakdown level as it attempts to stage an upside reversal.
Examine the full post from Rachel Dashiell.
The Chart Report curates best-in-class technical analysis from across the web.
If you’d like to share a chart or just say hello, email us at [email protected]