Record Momentum Carries the S&P Above 7000 📈 The Chart Report

Chart of the Day
🏆 Today's Chart of the Day was shared by Warren Pies.
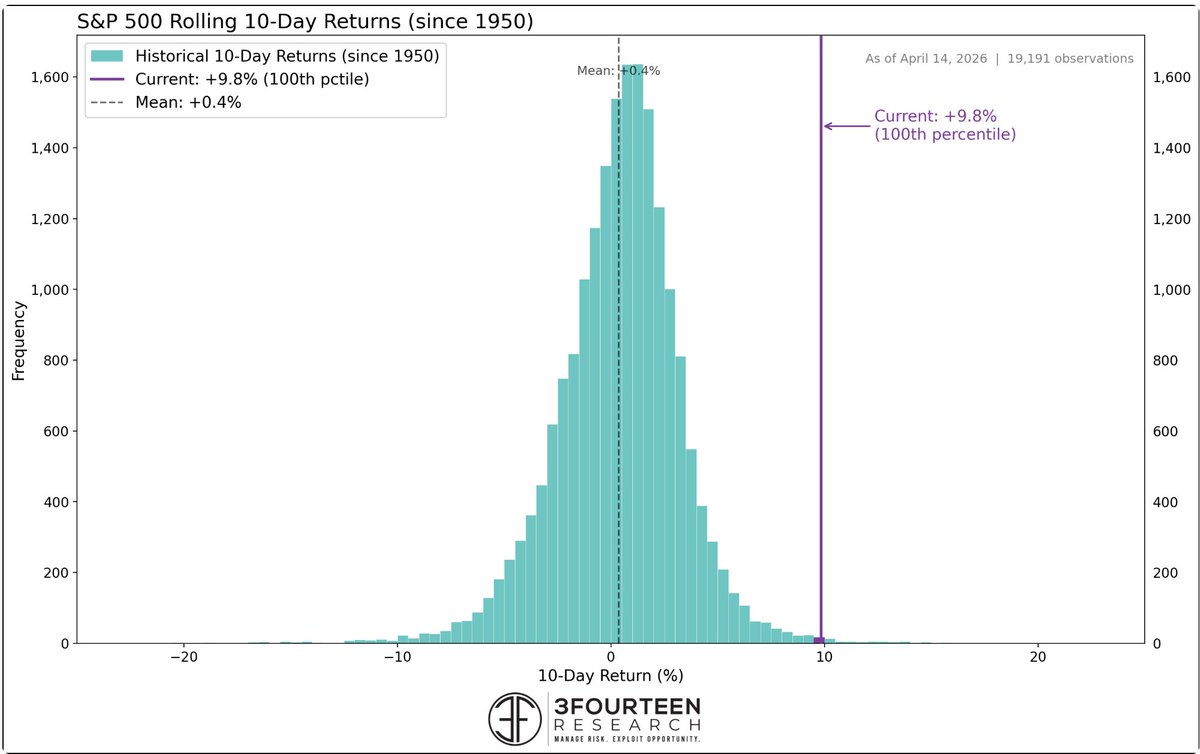
The S&P 500 just closed at new all-time highs after surging +9.8% over the past 10 sessions, placing this move in the 99.7th percentile of all 10-day returns.
Since 1950, this kind of momentum has only occurred about 20 times, with forward 12 month returns averaging roughly 19%.
Unlike prior instances that occurred within deeper drawdowns, this rally is occurring without the same level of damage, making this thrust a clear statement of underlying market strength.
The Takeaway: The S&P 500 has seen a historic 10-day rally into new record highs.
More Great Charts
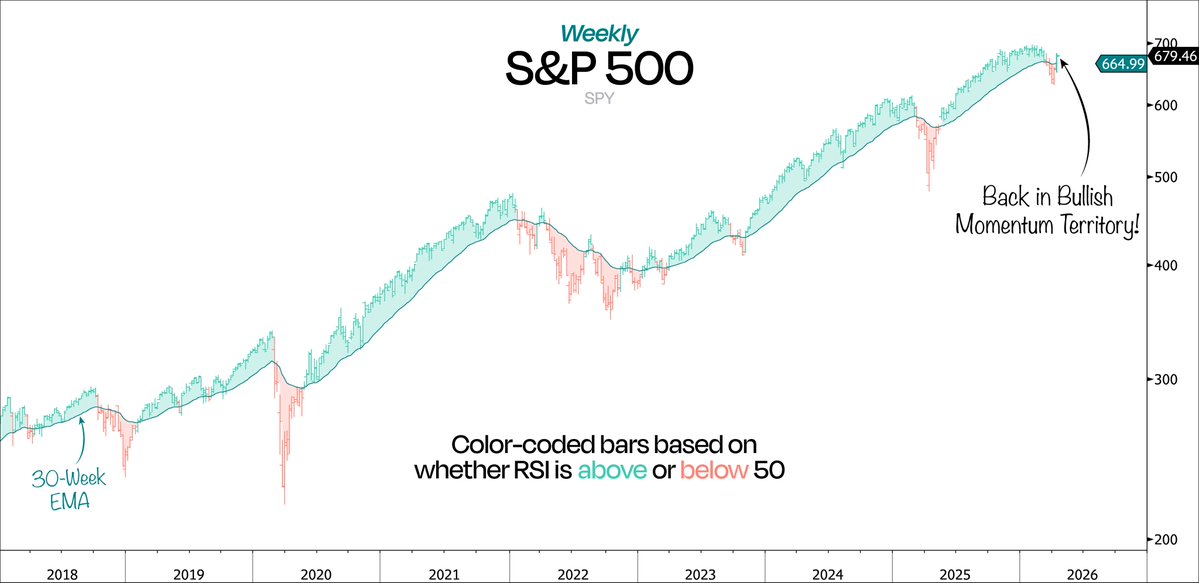
After four consecutive weeks of bearish momentum, price has reclaimed the 50 level on the weekly RSI and is back in bullish momentum territory.
View the full tweet from Duality Research.
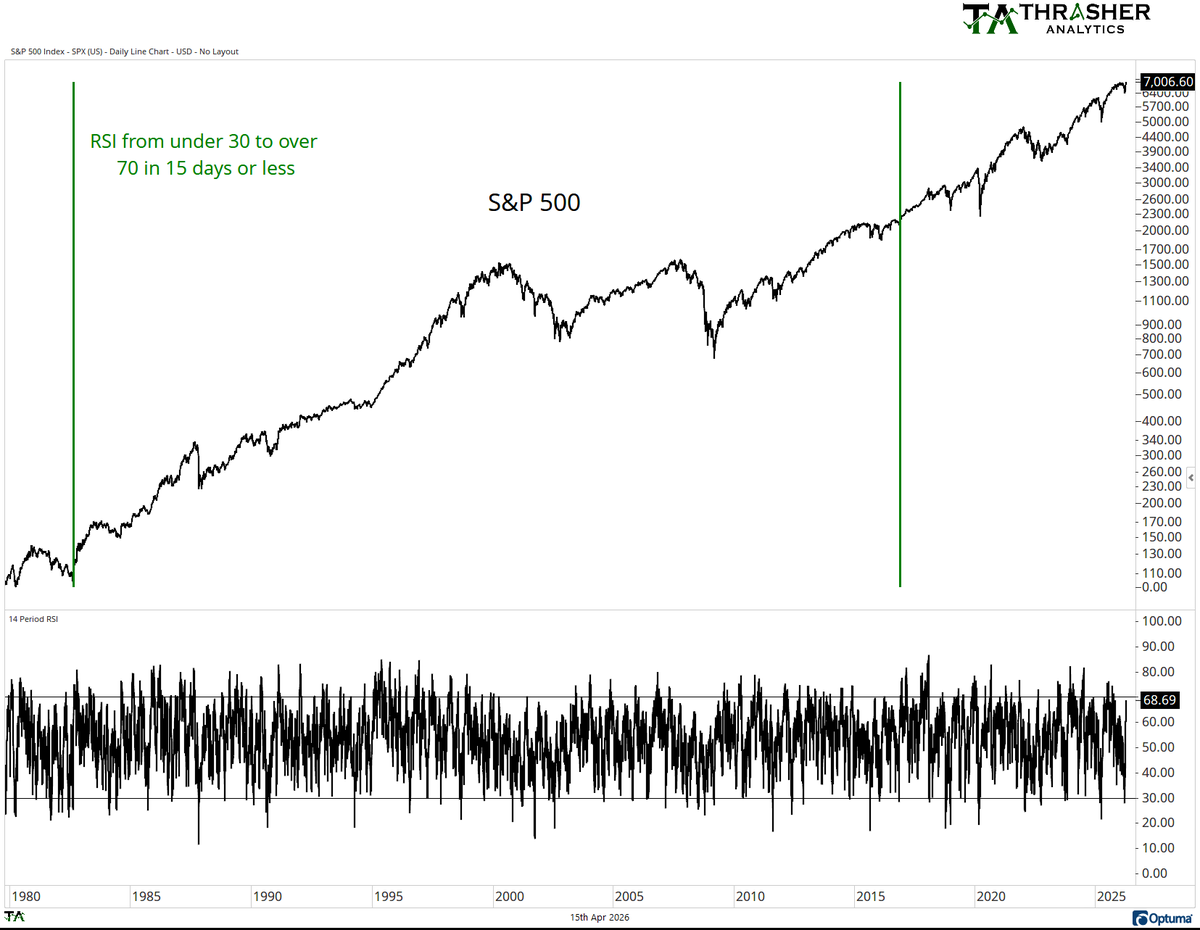
Since 1980, there have only been two instances where RSI moved from below 30 to above 70 in just 15 days: November 2016 and August 1982.
The current move is not quite there yet, but it's close.
See the complete post from Andrew Thrasher.
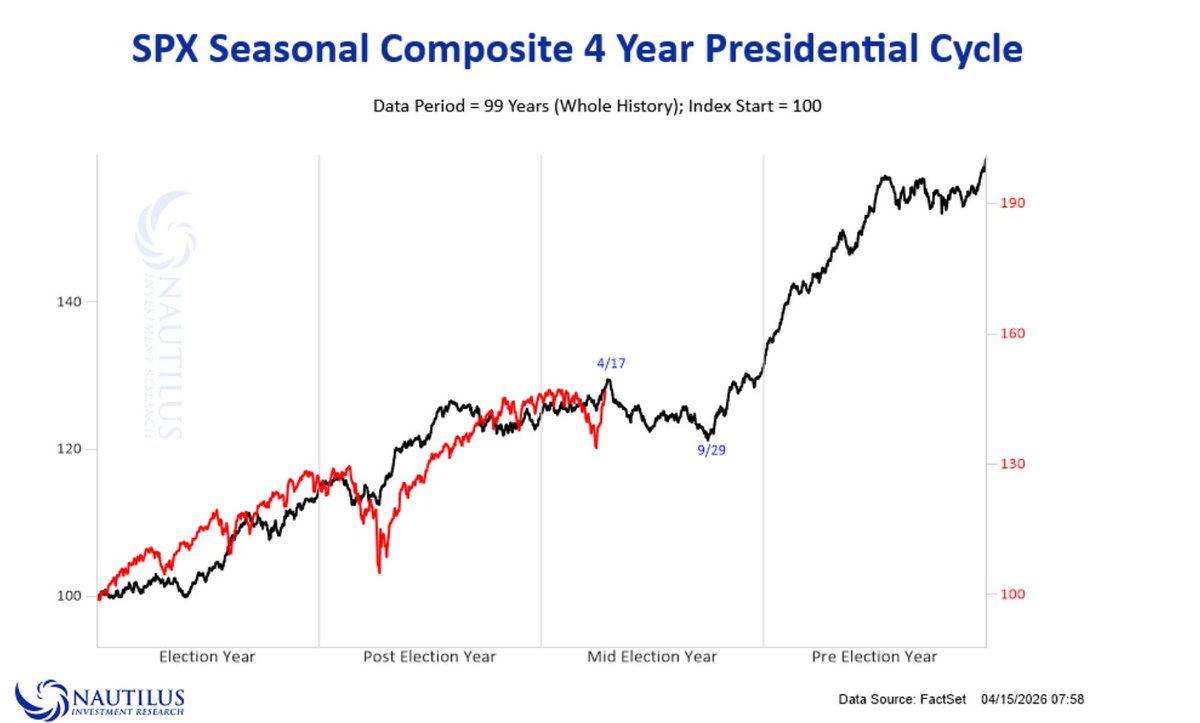
Midterm election years have historically tended to peak around now.
Examine the entire tweet from NautilusCap.
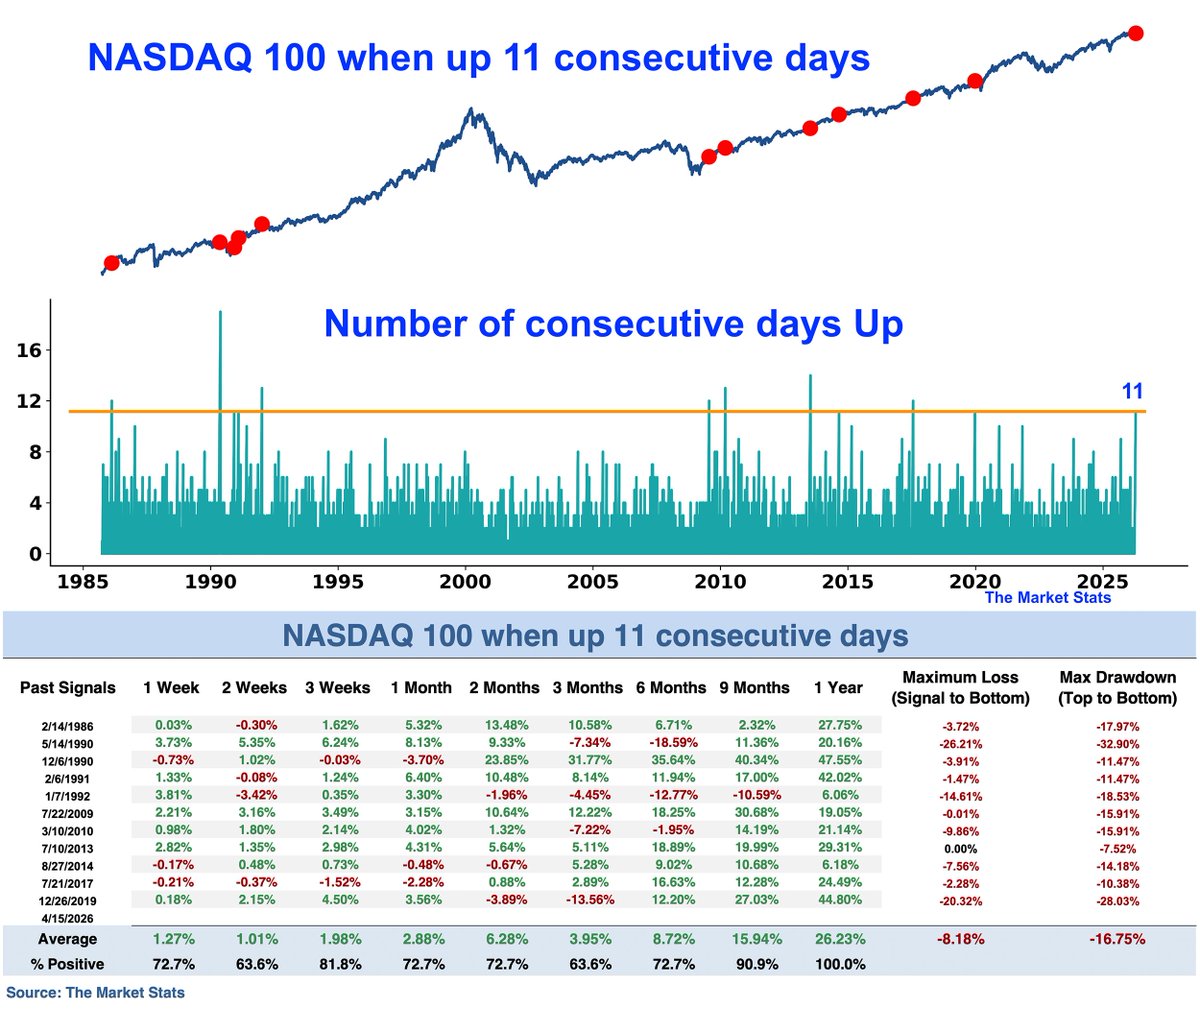
The NASDAQ has closed higher for 11 consecutive sessions.
Similar streaks have led to the index being higher one year later 100% of the time, with an average gain of +26%.
Check out the whole post from TheMarketStats.
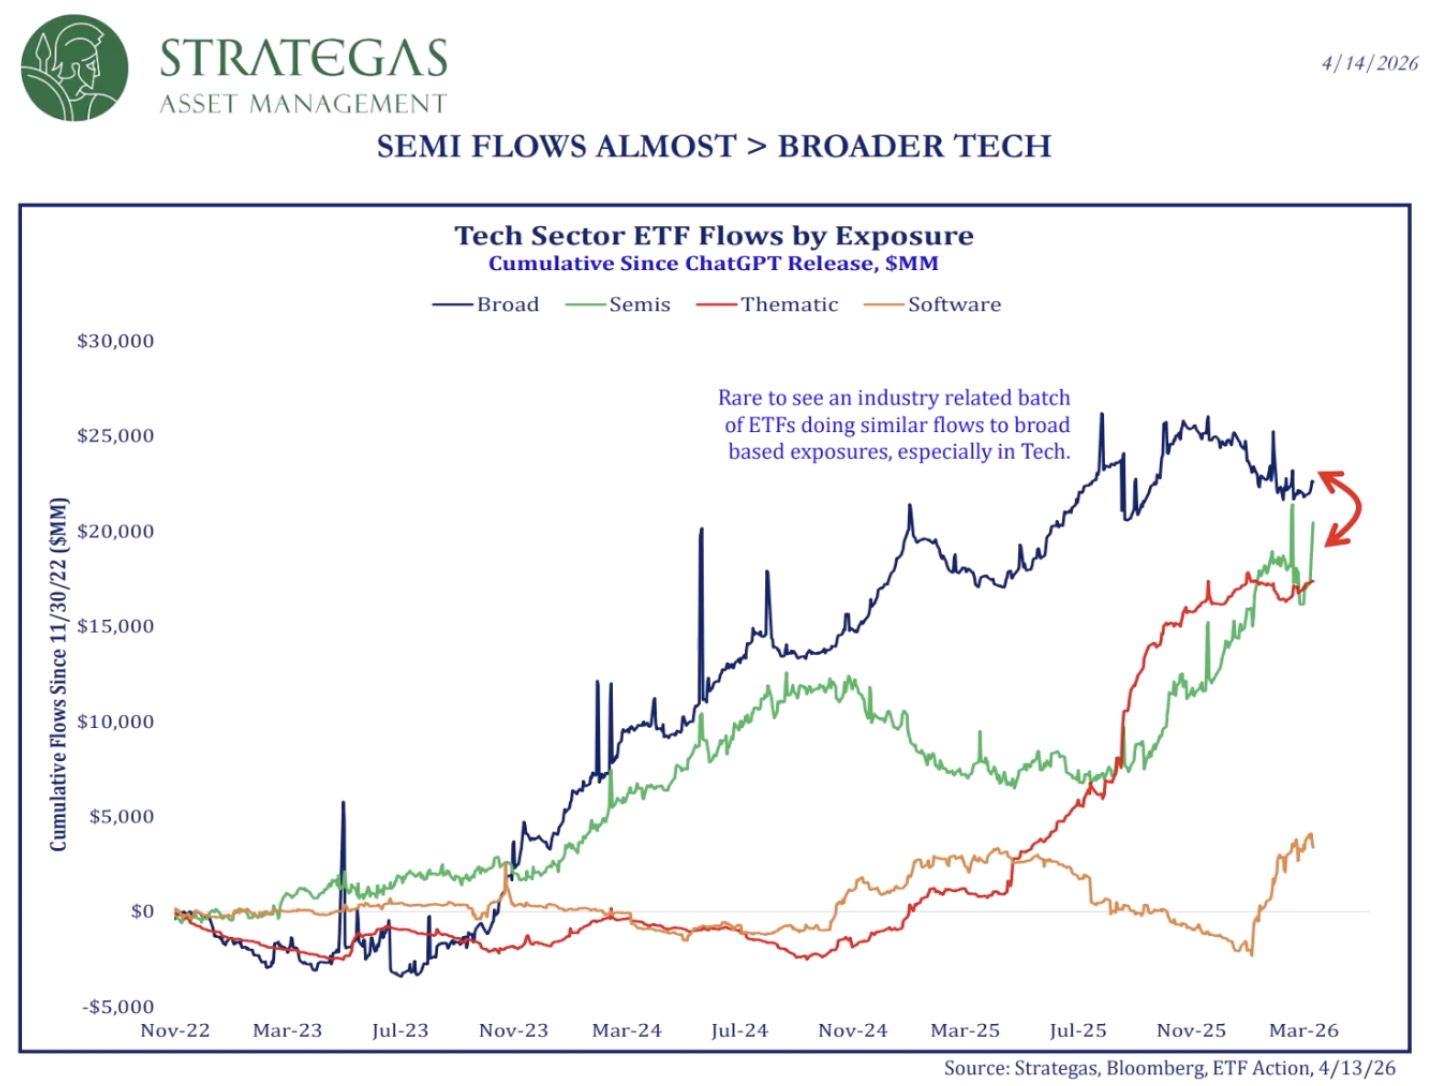
Flows into semiconductors are now approaching total flows into the broader technology sector.
Watch the full breakdown from Todd Sohn.
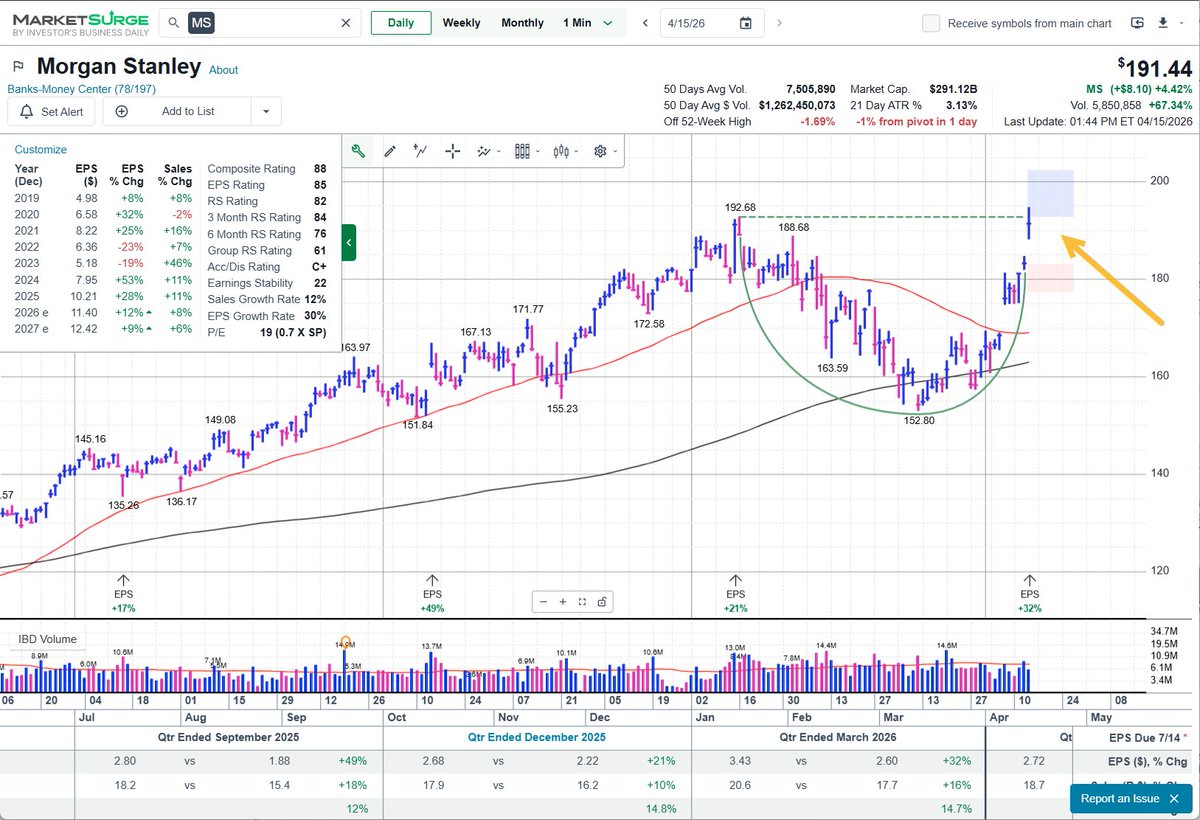
Morgan Stanley, one of the largest names in the Financial sector, is trading back at all-time highs following its Q1 earnings report.
View the whole post from Evan Medeiros.
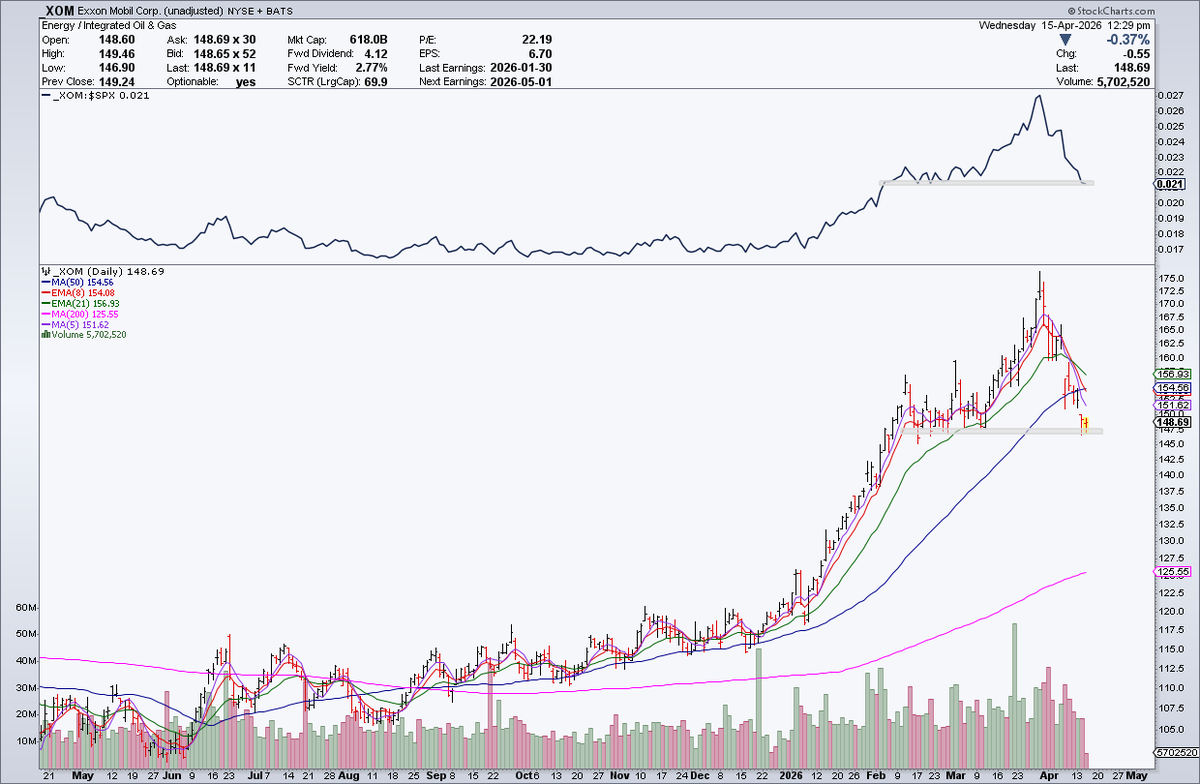
Exxon Mobil is testing its pivot lows on both an absolute and relative basis.
Check out the entire tweet from David Rath.
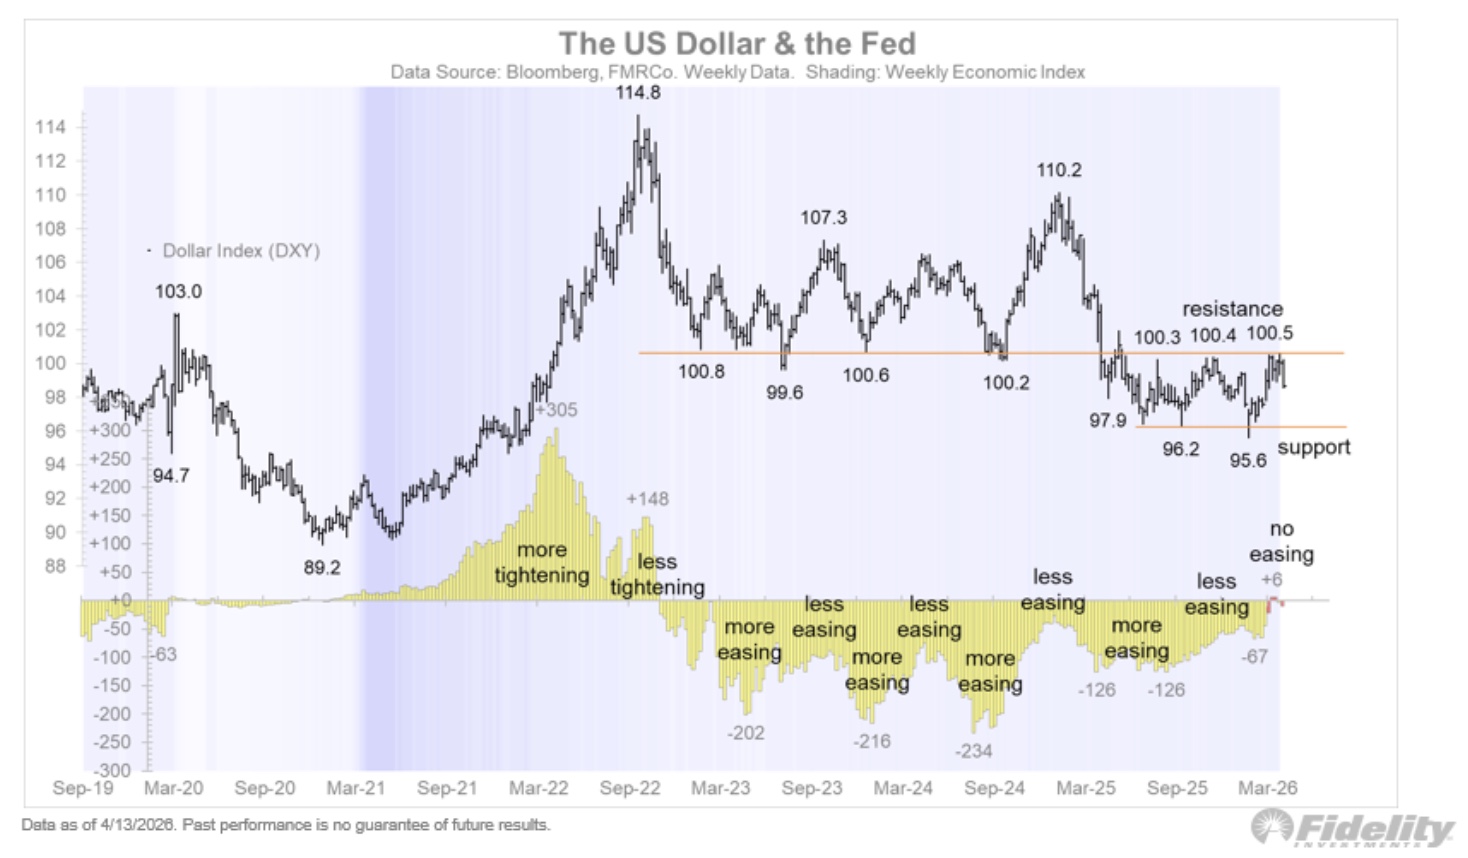
The U.S. Dollar Index has once again rejected the polarity level of 100.
Read the complete analysis from Jurrien Timmer.
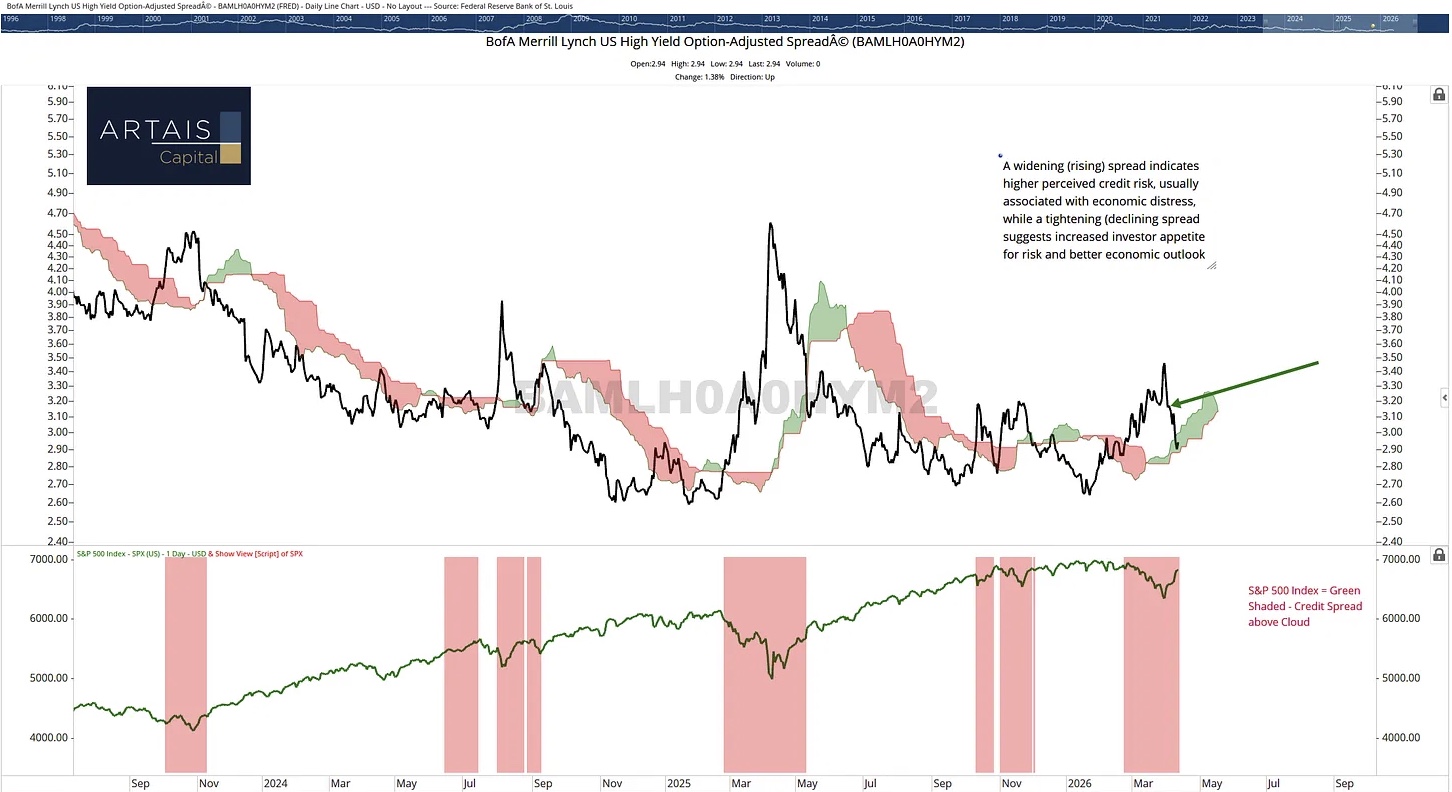
High-yield credit spreads continue to tighten following the recent spike.
Explore the latest article from John Rothe.
The Chart Report curates best-in-class technical analysis from across the web.
If you’d like to share a chart or just say hello, email us at [email protected]