This Isn’t What Capitulation Looks Like 📉 The Chart Report

Chart of the Day
🏆 Today's Chart of the Day was shared by Alan Cohen.
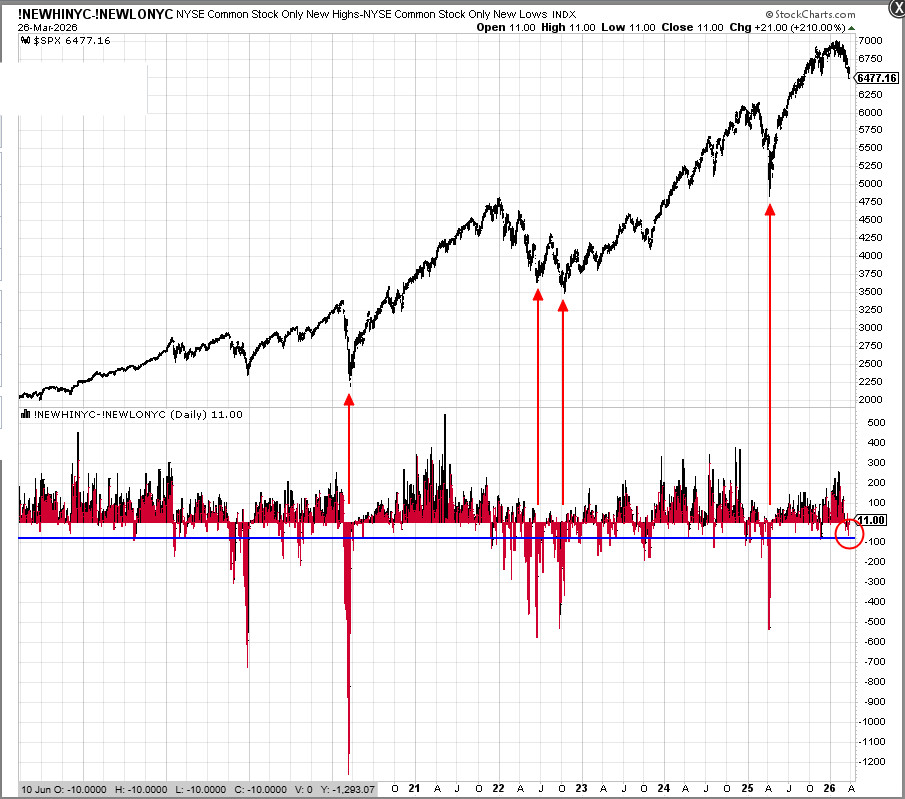
The S&P 500 continues to leak lower, closing at a fresh year-to-date low while stringing together its longest weekly losing streak since the 2022 bear market.
Despite the steady drawdown, NYSE New Highs - New Lows hasn’t reached the kind of negative readings that typically coincide with panic-driven washouts.
So while sentiment across social media and headlines feels dire, the underlying data suggests that stocks can get much more oversold.
The Takeaway: The S&P 500 logs another consecutive down week, as the data indicates that stocks aren't yet deeply oversold.
More Great Charts
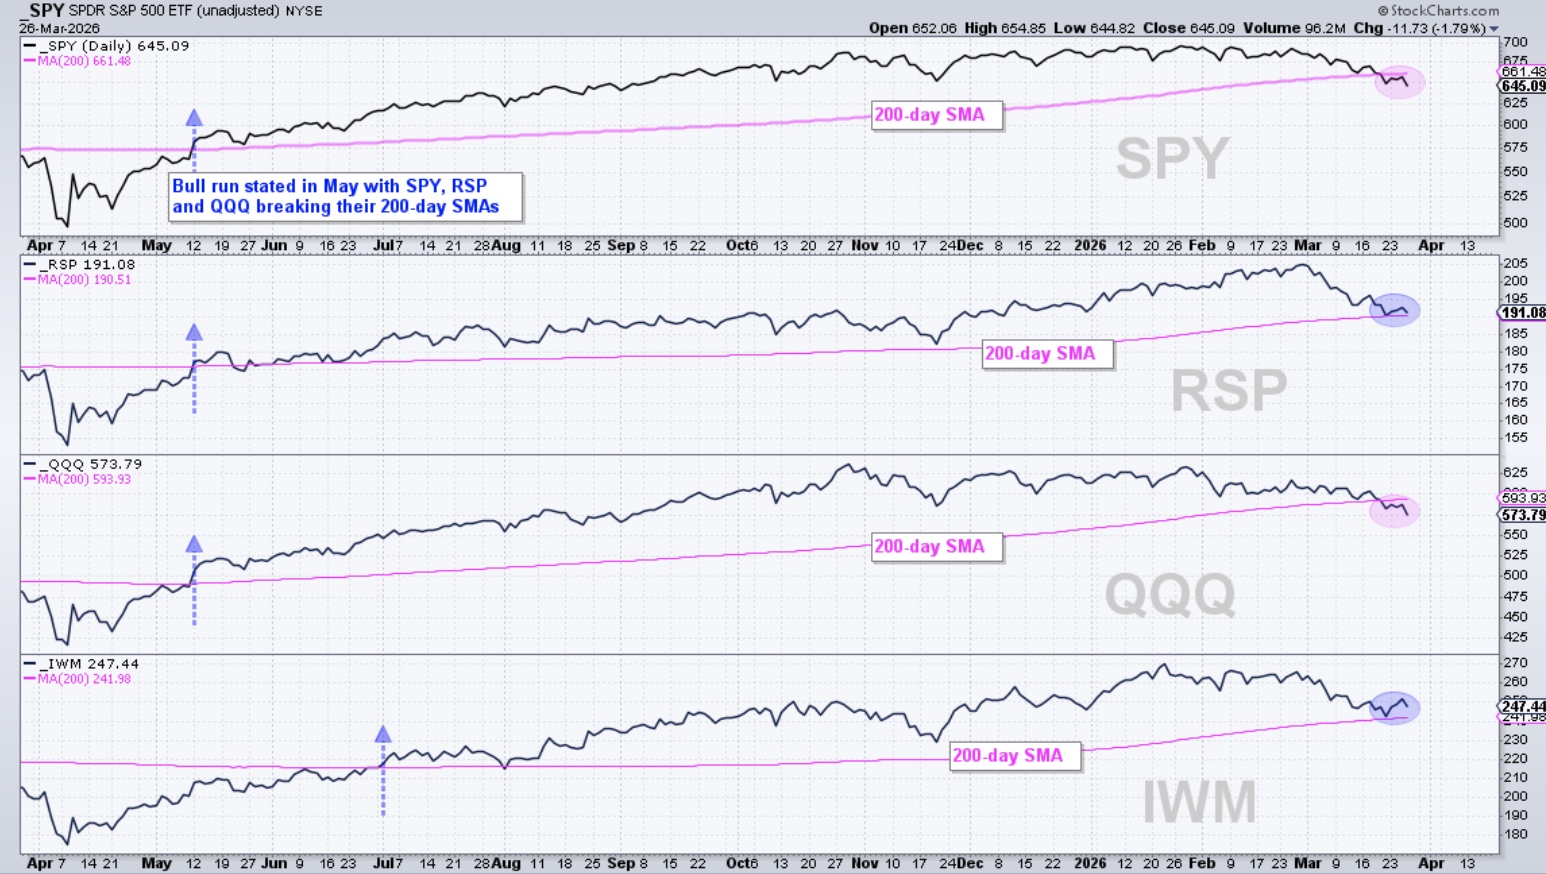
The Equal Weight S&P and Russell 2000 remain slightly above their rising 200-day SMAs, while SPY and the Nasdaq have slipped below theirs.
Check out the full article from Arthur Hill.
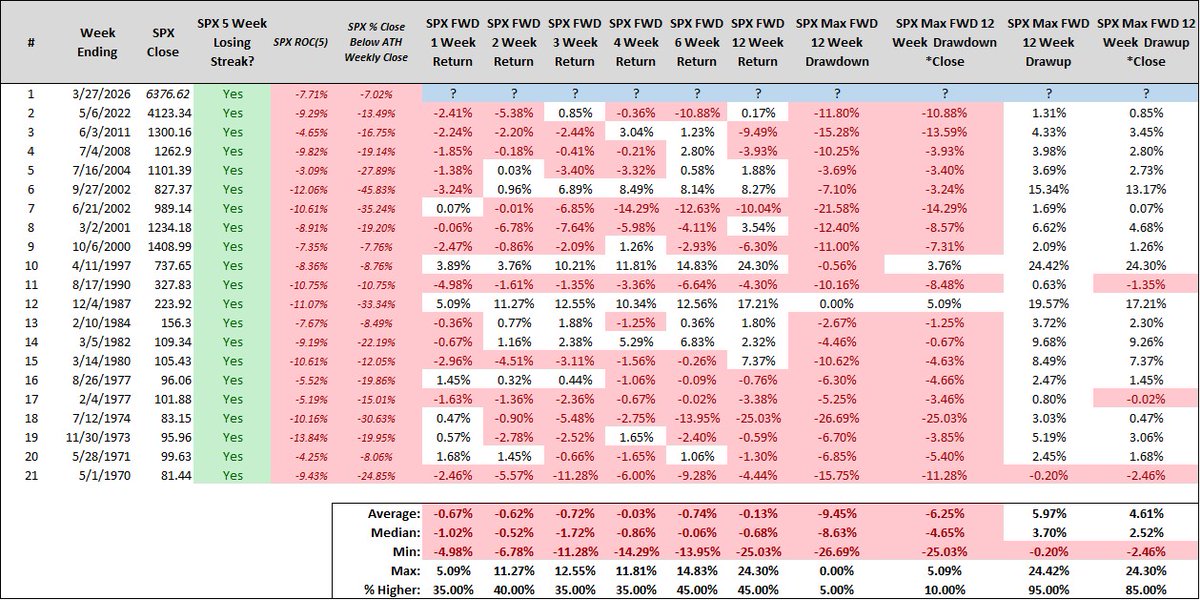
The S&P 500 has posted its 21st 5-week decline since 1970.
You may assume such streaks usually lead to strong market gains, but that’s often not the case.
Examine the whole tweet from Steve Deppe.
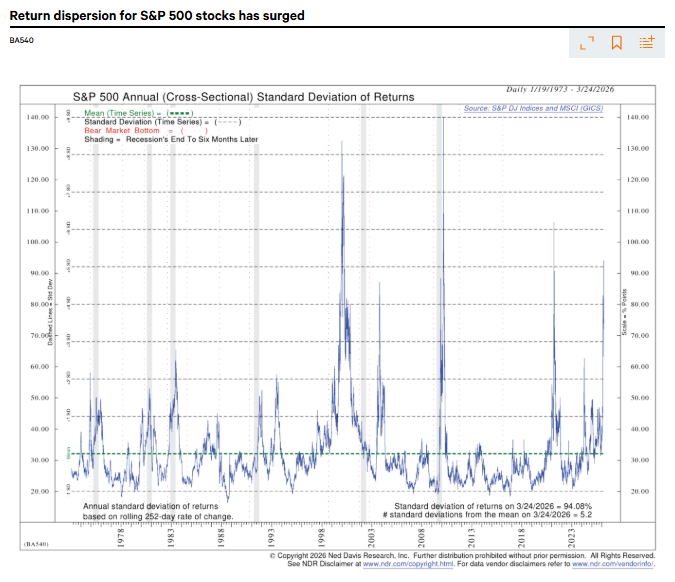
Return dispersion across S&P 500 stocks has surged to over 5 standard deviations above its long-term average, only surpassed during the Dot-Com crash, GFC, and COVID reopening.
See the entire tweet from Rob Anderson.
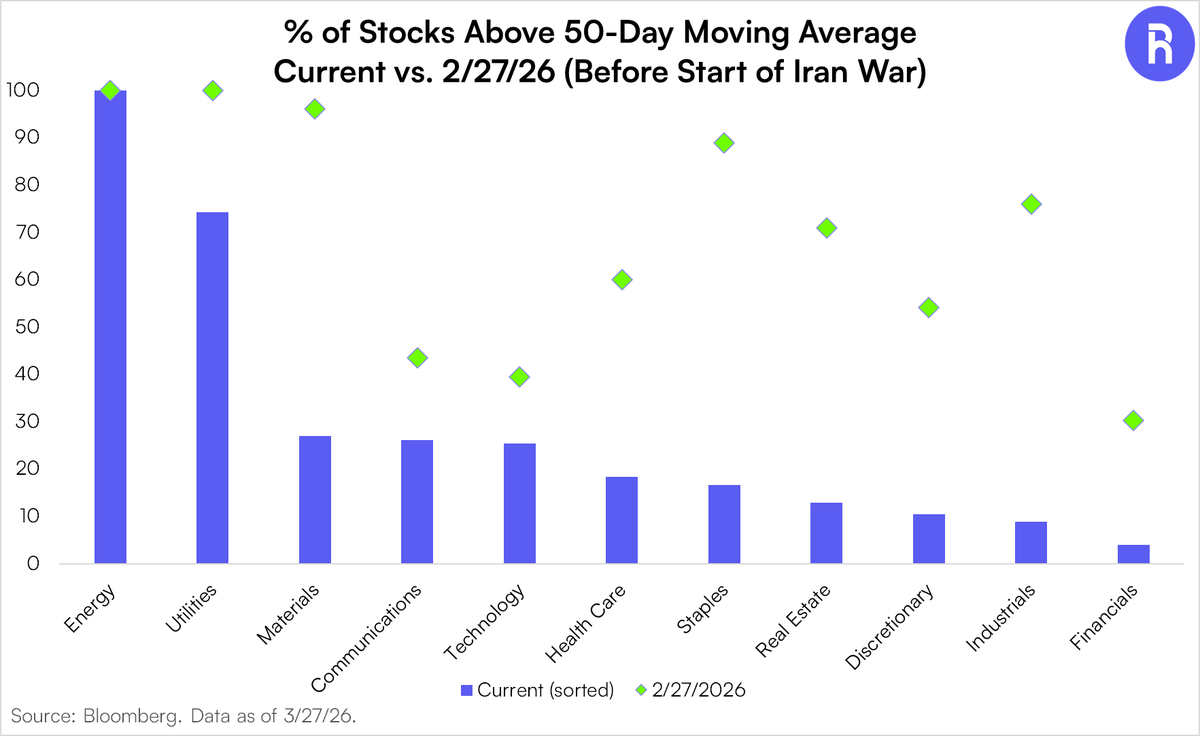
Most sectors have undergone a meaningful reset since the start of the Iran war, with Energy and Utilities being the key exceptions.
View the complete post from Thomas DiFazio.
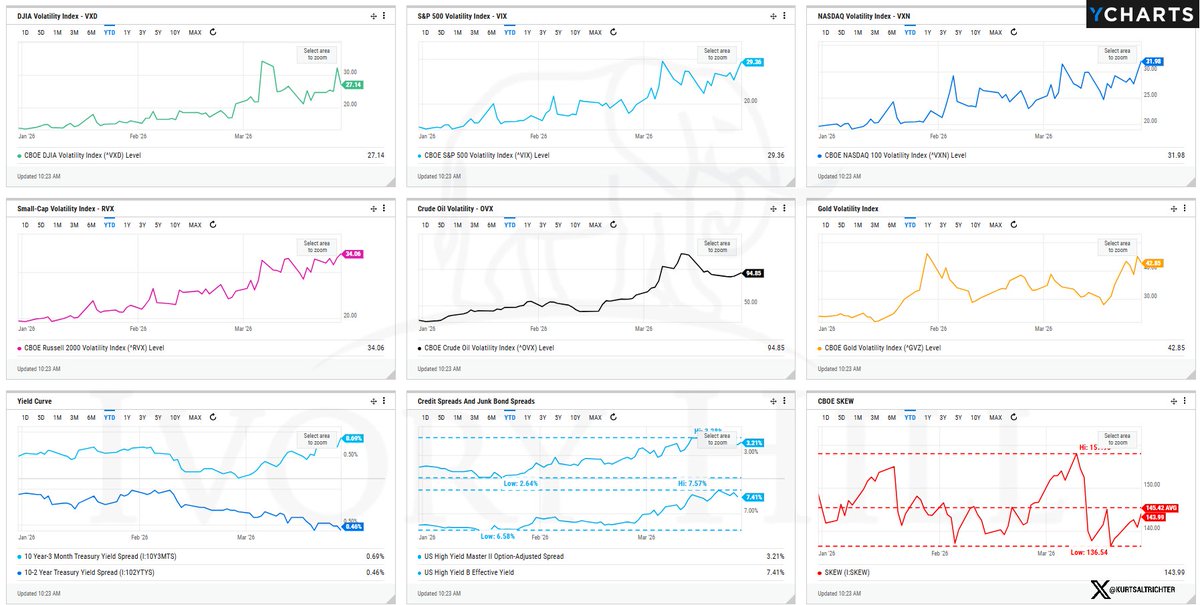
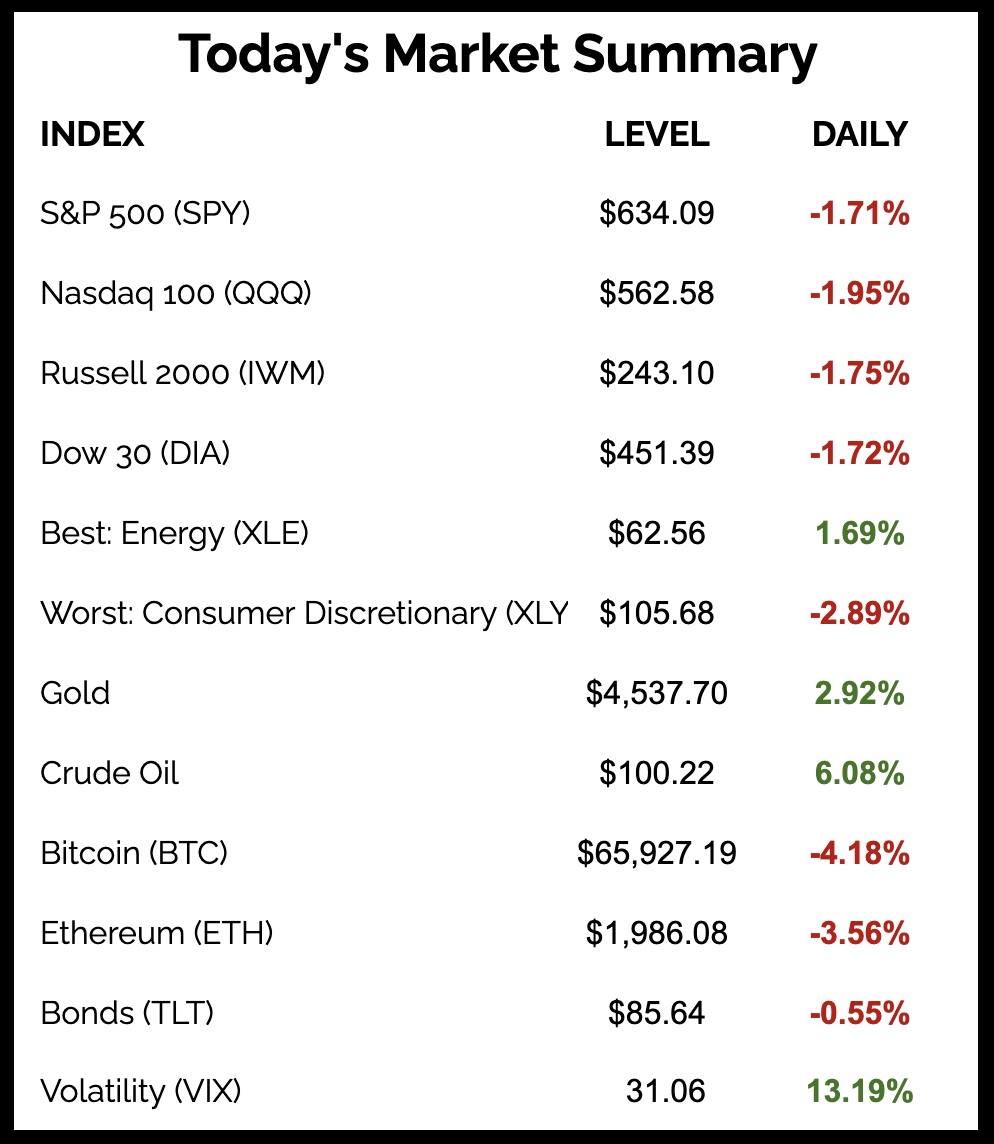
Volatility is elevated across all major asset classes simultaneously.
Examine the whole tweet from Kurt Altrichter.
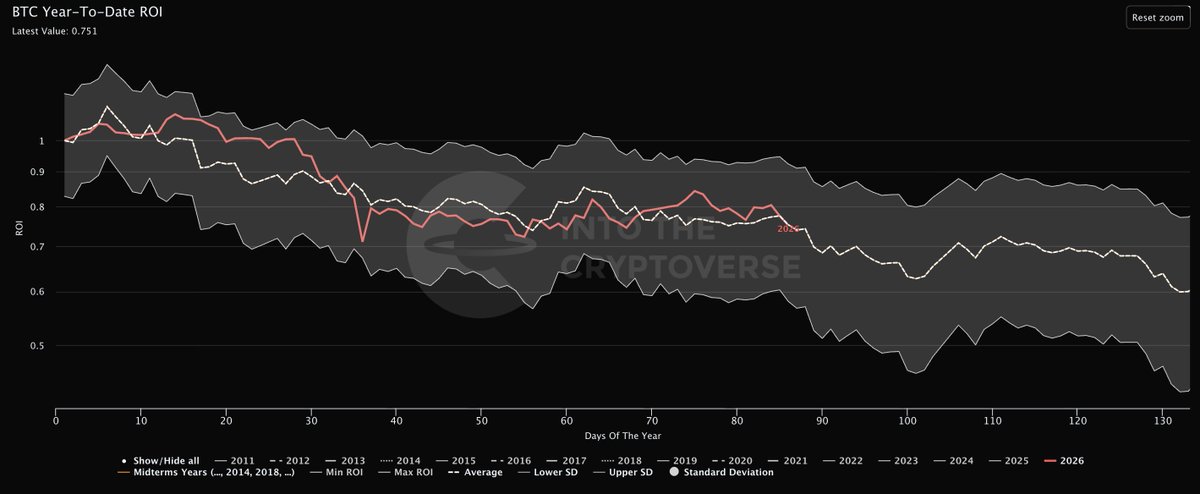
Bitcoin continues to follow its midterm year blueprint.
See the whole post from Benjamin Cowen.
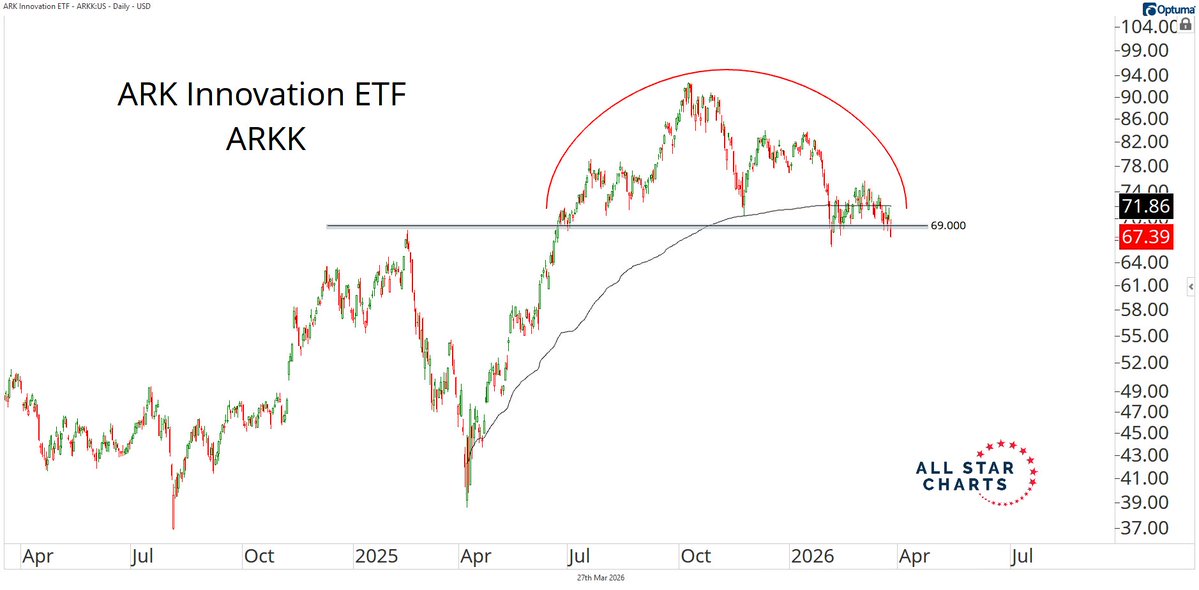
The benchmark for speculative growth, ARK Innovation, is completing a year-long distribution pattern.
Access the full analysis from Alfonso De Pablos.
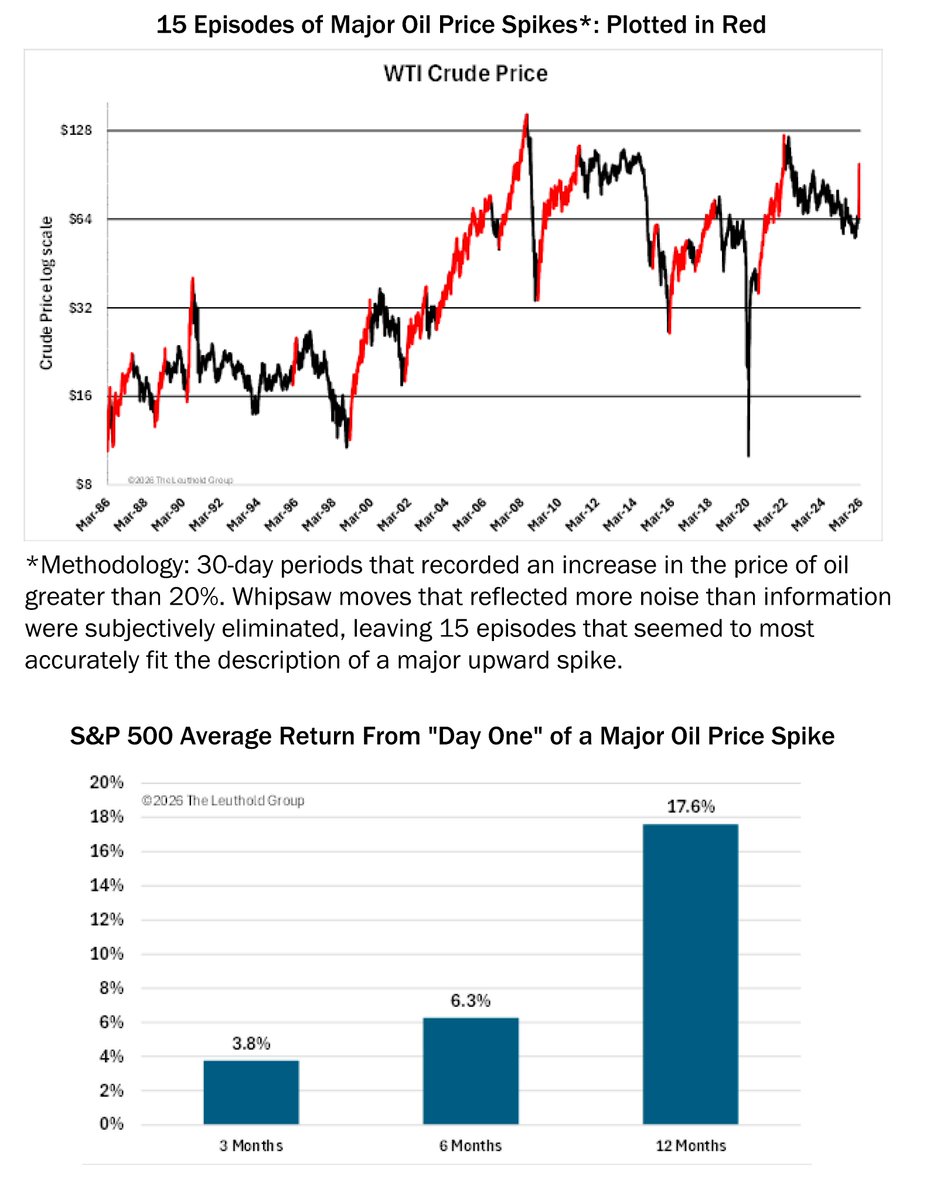
Despite the shock, past oil spikes have often been followed by solid forward returns for the S&P 500.
View the entire tweet from Leuthold Group.
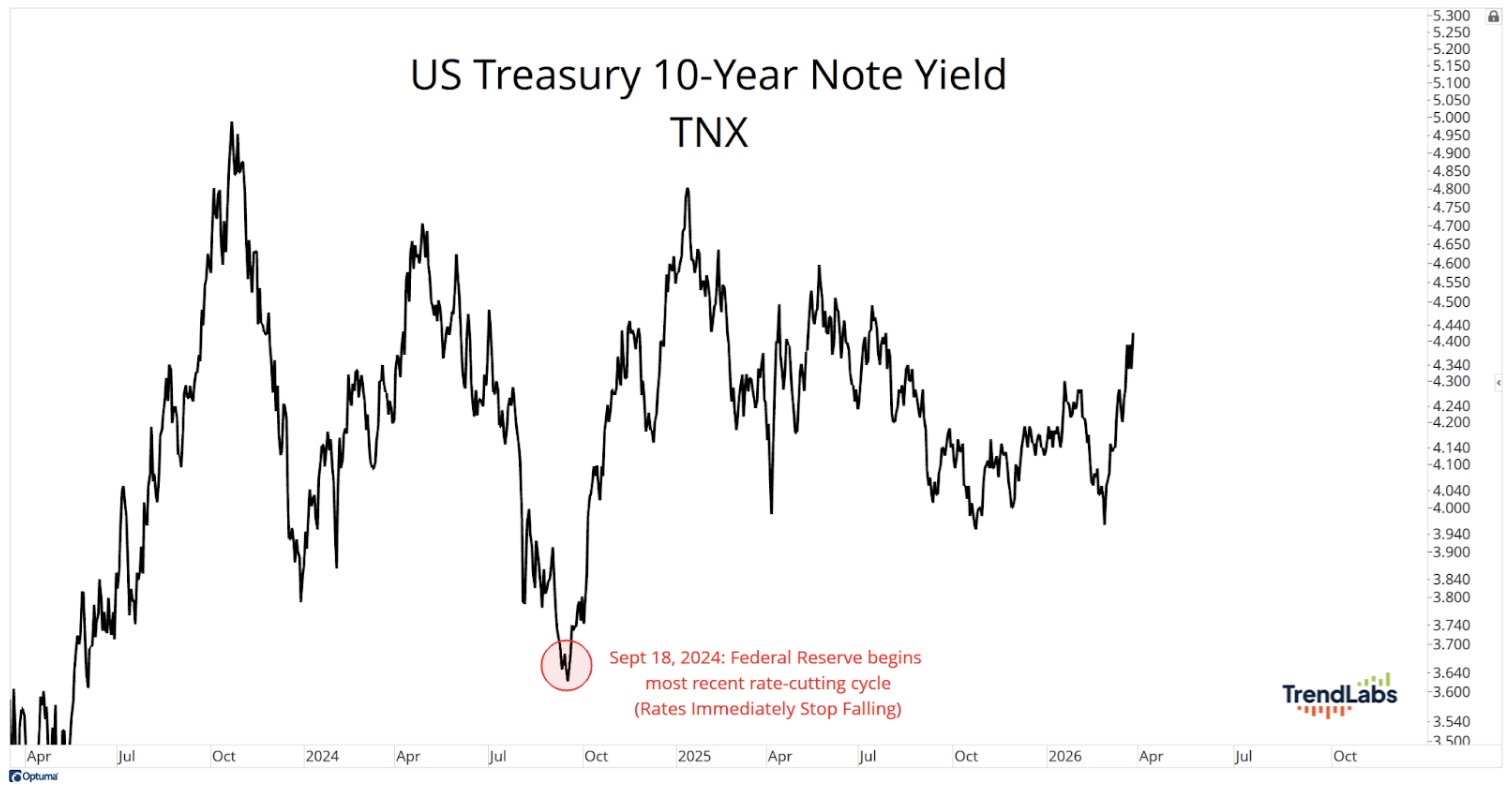
Ironically, interest rates stopped declining immediately after the Federal Reserve began cutting rates.
Read the complete article from JC Parets.
The Chart Report curates best-in-class technical analysis from across the web.
If you’d like to share a chart or just say hello, email us at [email protected]