We Got A Bounce, But Can It Stick? 📈 The Chart Report

Chart of the Day
🏆 Today's Chart of the Day was shared by Yuriy Matso.
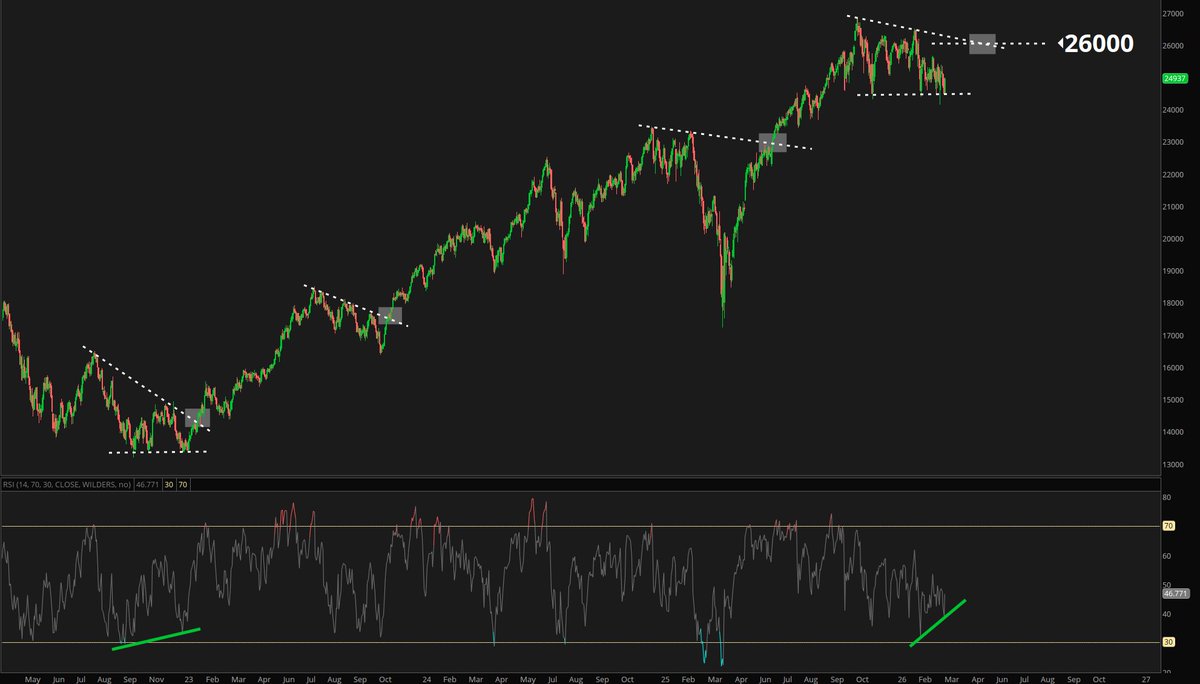
After closing at its lowest level of the year on Friday, the Nasdaq gapped higher to start the week and finished the session up over 1%.
The Nasdaq continues to hold support near 24,000, with a move back above 26,000 potentially signaling the next leg higher.
Momentum is also beginning to improve as the Relative Strength Index made a higher low, suggesting selling pressure may be fading.
The Takeaway: If support holds, 26,000 remains a key level to watch, with a reclaim signaling buyers may be regaining control.

More Great Charts
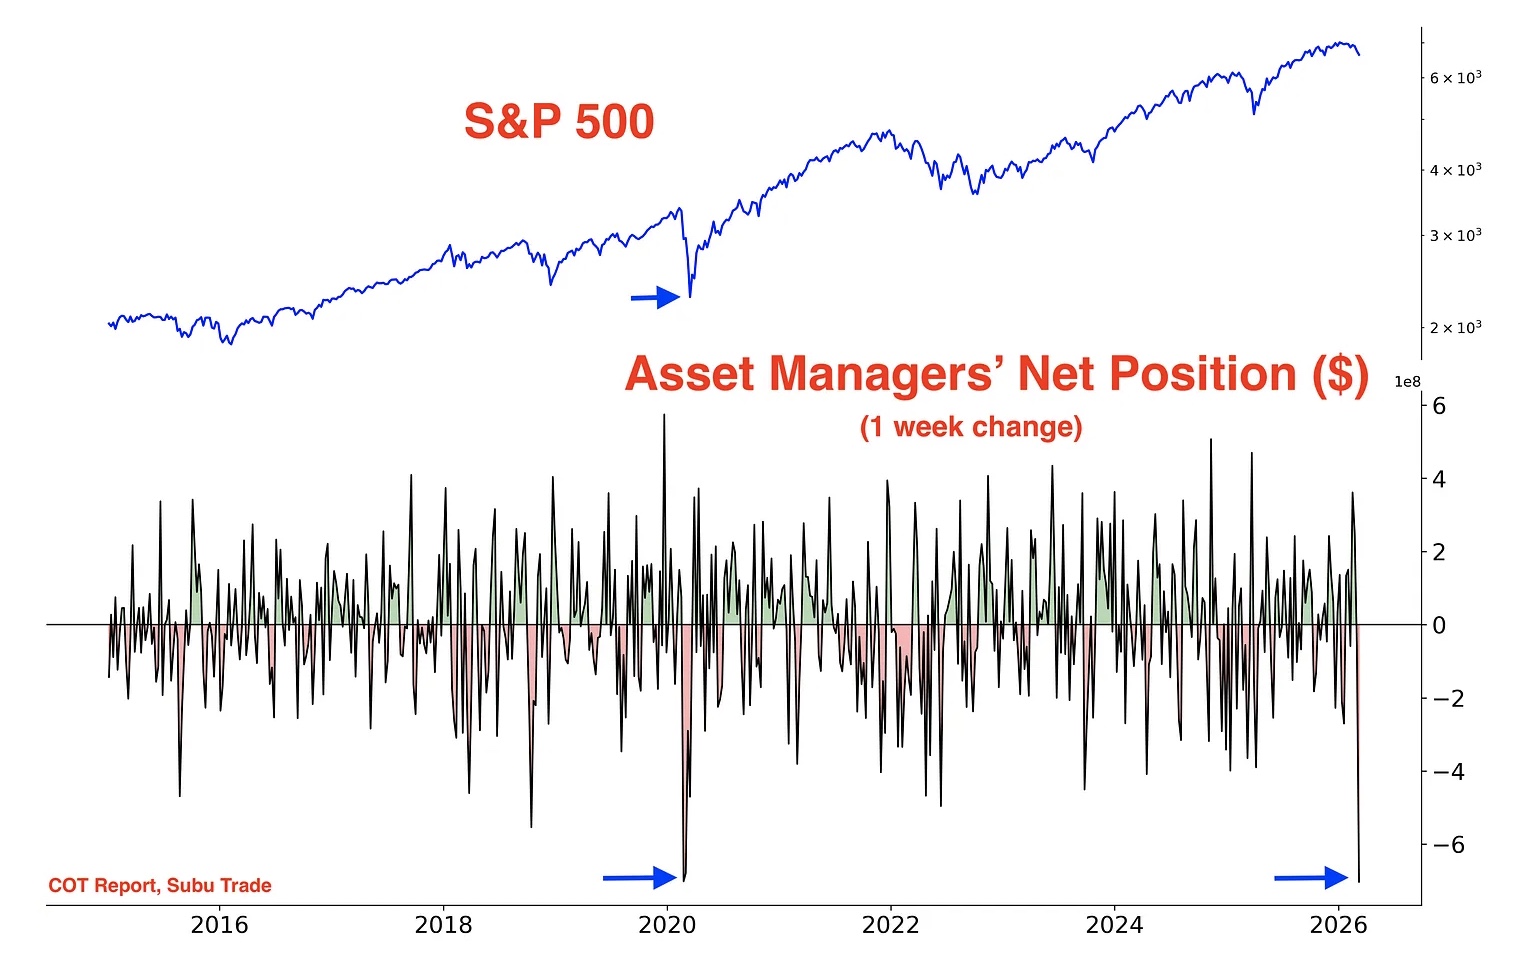
Last week we saw the largest one week drop in Asset Managers’ net positioning (by dollar value) since the Covid crash.
Check out the latest analysis from SubuTrade.

History suggests geopolitical shocks often create opportunity rather than lasting market damage.
View the complete post from Brian Sozzi.
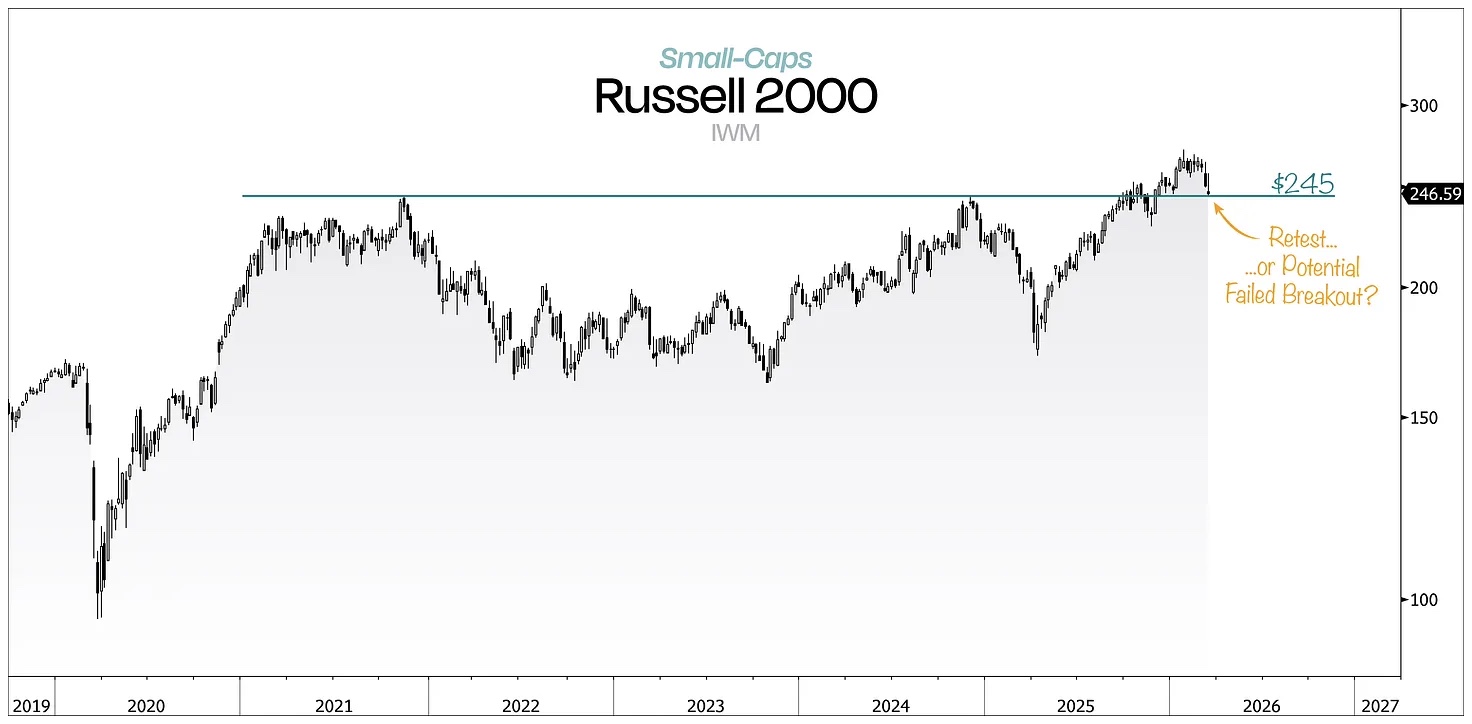
This resembles a classic breakout-retest for the Russell 2000, with the potential to also become a failed breakout.
Access the full breakdown from Duality Research.

The Financial sector sits a key level defined by the rising trendline and the 50% retracement from its April low to its all-time high.
See the entire tweet from John Rothe.
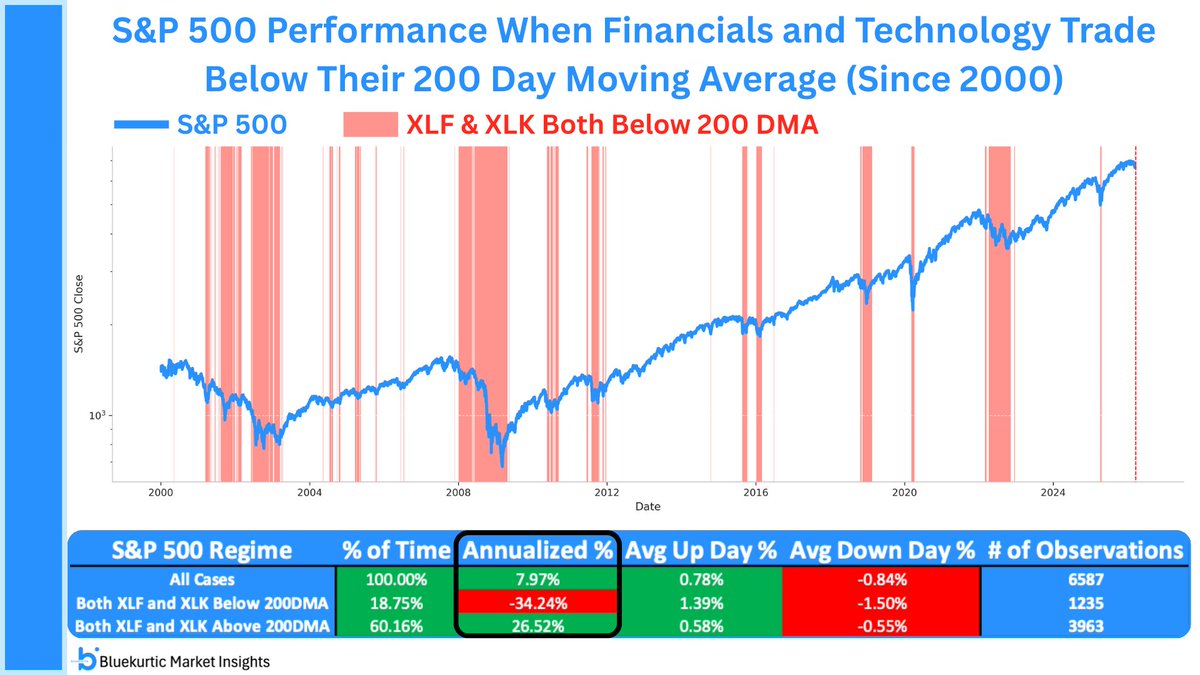
Financials and Technology account for roughly 45% of the S&P 500.
When both sectors trade below their 200 day moving averages, the index has historically suffered steep drawdowns.
View the whole post from Bluekurtic.

Consumer Staples is retesting its former breakout level near $84 alongside the 50-day moving average.
Explore the latest article from Mike Zaccardi.

The longer ARK Innovation ($ARKK) holds at current prices without attracting buyers, the greater the risk of a breakdown.
Check out the full tweet from Aksel Kibar.
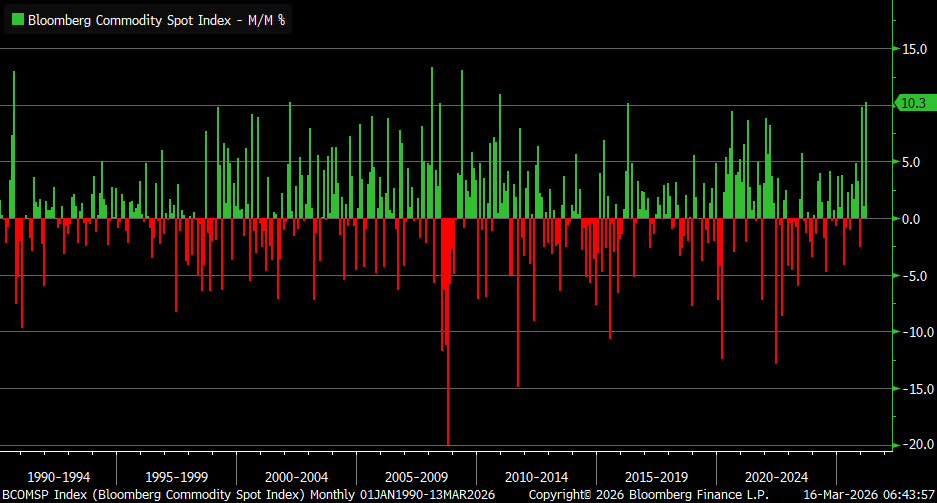
Halfway into March, The Bloomberg Commodity Spot Index is on track for its best month since December 2010.
See the complete post from Kevin Gordon.

Are you prepared for a new secular uptrend in interest rates?
View the entire tweet from Hamilton.
The Chart Report curates best-in-class technical analysis from across the web.
If you’d like to share a chart or just say hello, email us at [email protected]