Is This Just Another Routine Pullback? 📈 The Chart Report

Chart of the Day
🏆 Today's Chart of the Day was shared by Charlie Bilello.
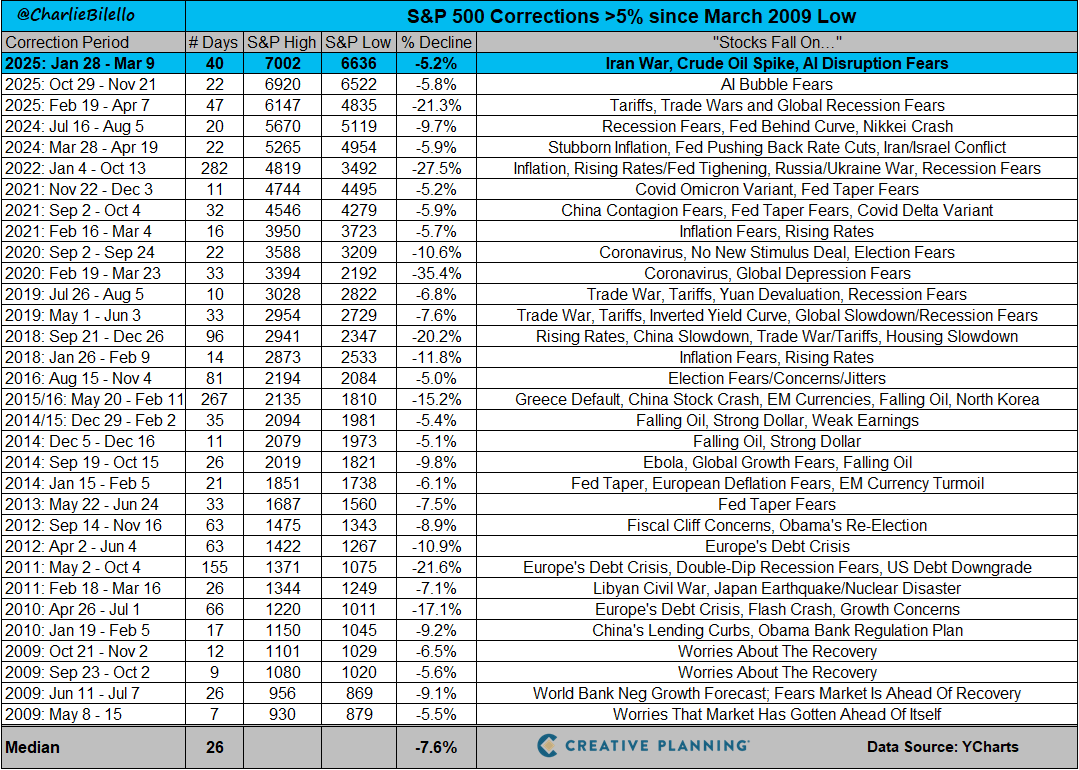
At today’s low, the S&P 500 ($SPX) was down just over 5% from its all-time high, marking the 32nd pullback greater than 5% since the March 2009 low.
This is $SPX’s first 5% pullback since last November, though such moves typically occur 3–4 times per year and are a normal part of market volatility.
History shows that every pullback comes with alarming headlines and feels catastrophic, yet over time, optimism has outperformed pessimism.
The Takeaway: The S&P 500 is seeing its first 5% pullback in four months, and while headlines may be eye-catching, the long-term playbook remains unchanged.
More Great Charts
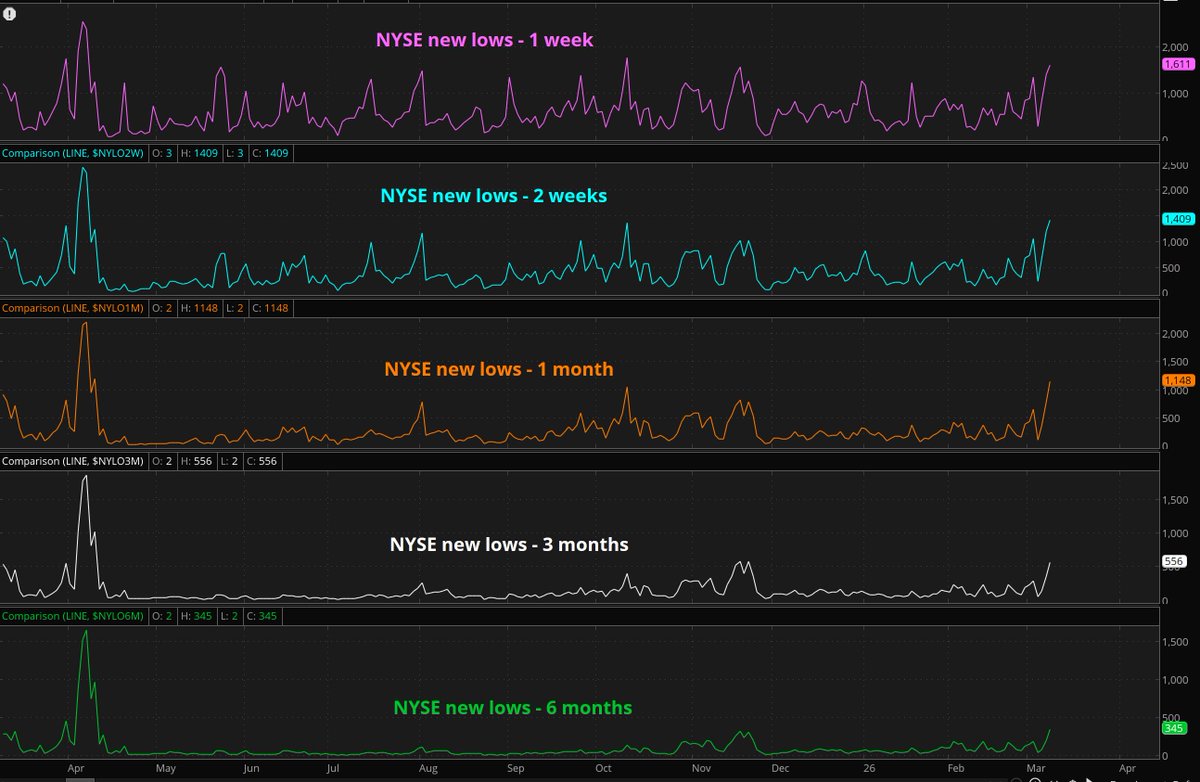
The NYSE new lows list has spiked to levels not seen since last year.
See the full post from Rachel Dashiell.
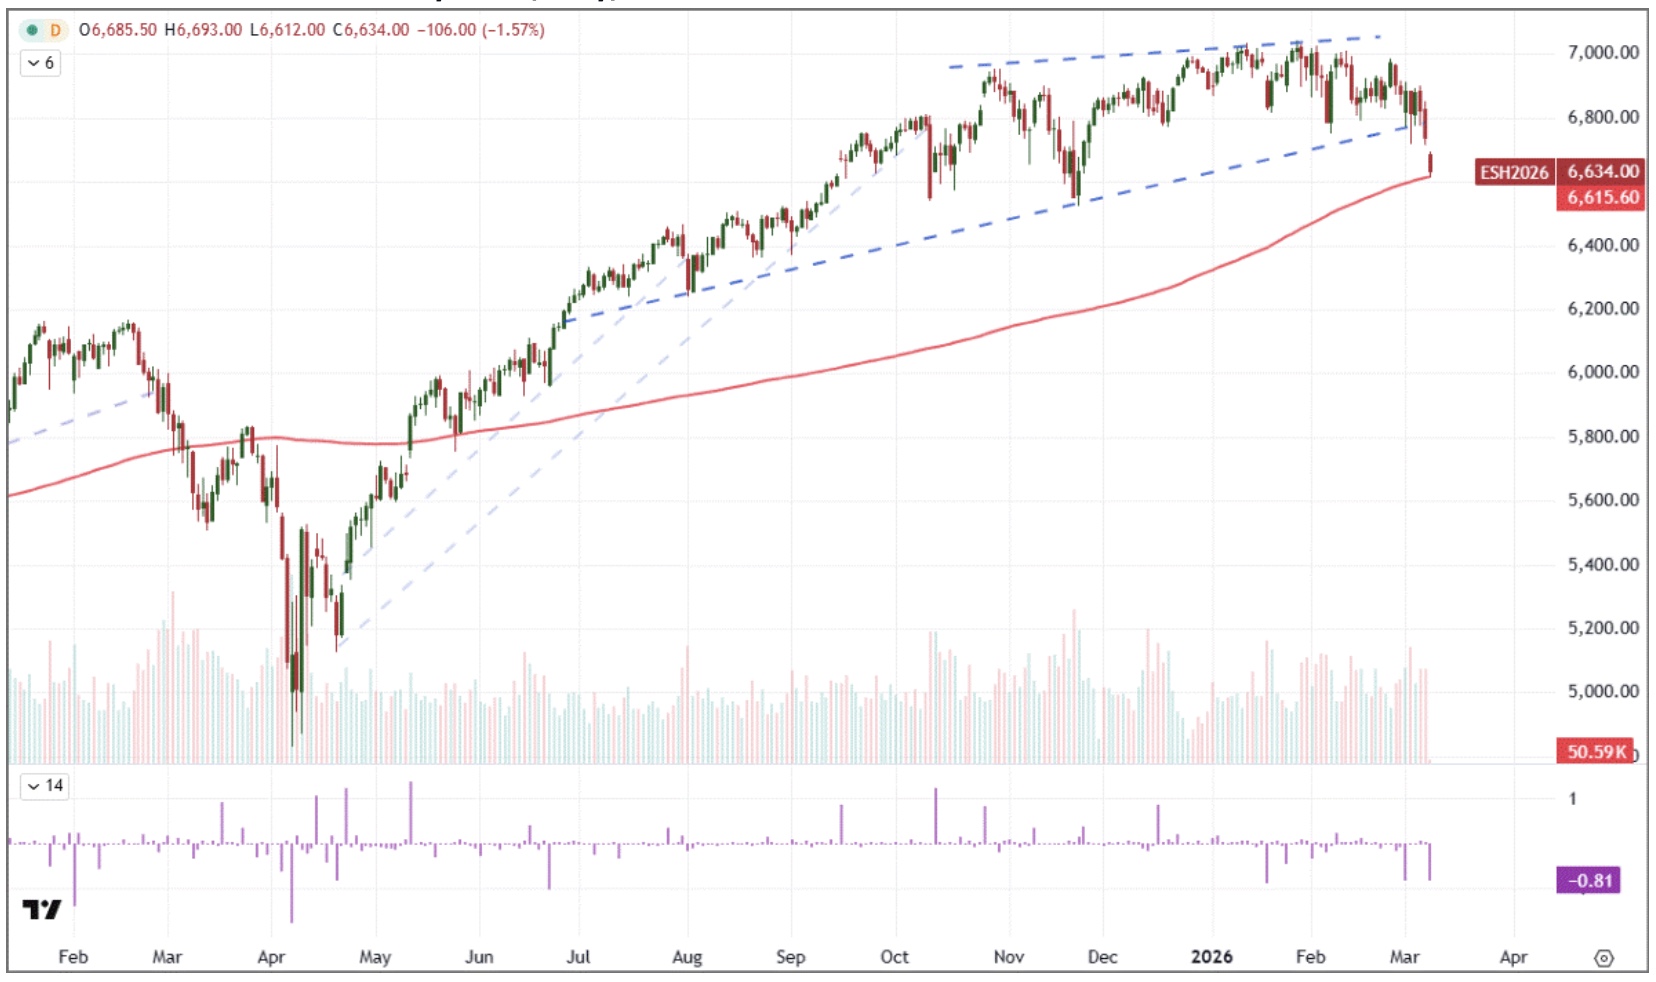
Caution is warranted, but full downside conviction requires strong evidence against an 11-month bull trend.
A breach of the 200-day SMA would add weight to the bearish argument.
Read the complete analysis from John Kicklighter.
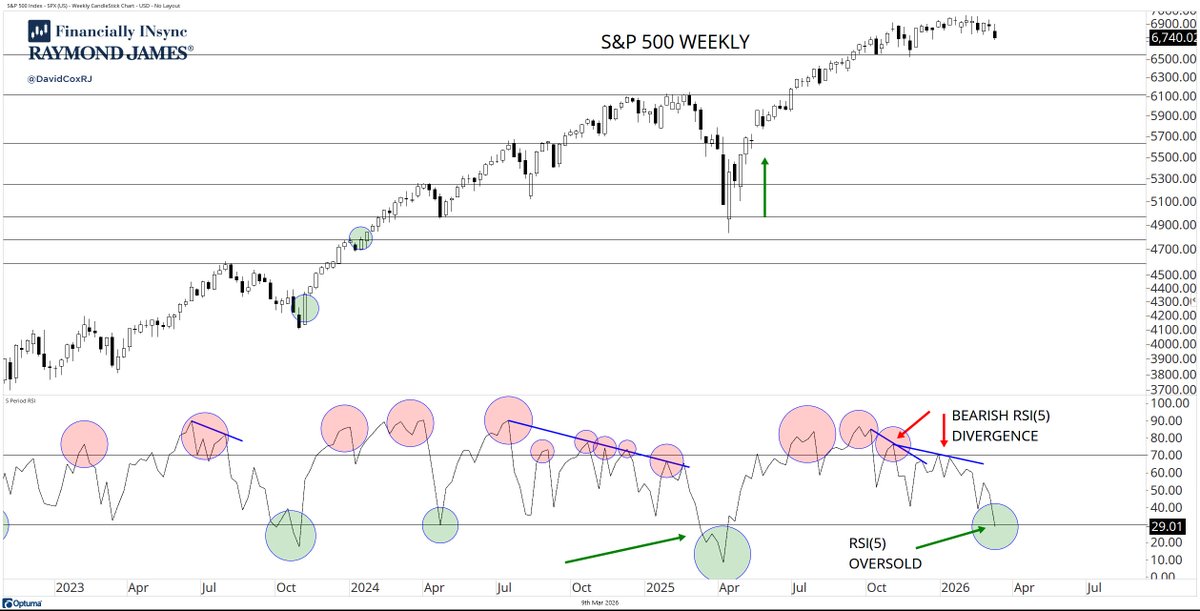
The weekly 5-period RSI for the S&P 500 is oversold for the first time since March/April of last year.
We typically see this signal about once per year.
View the full tweet from David Cox.
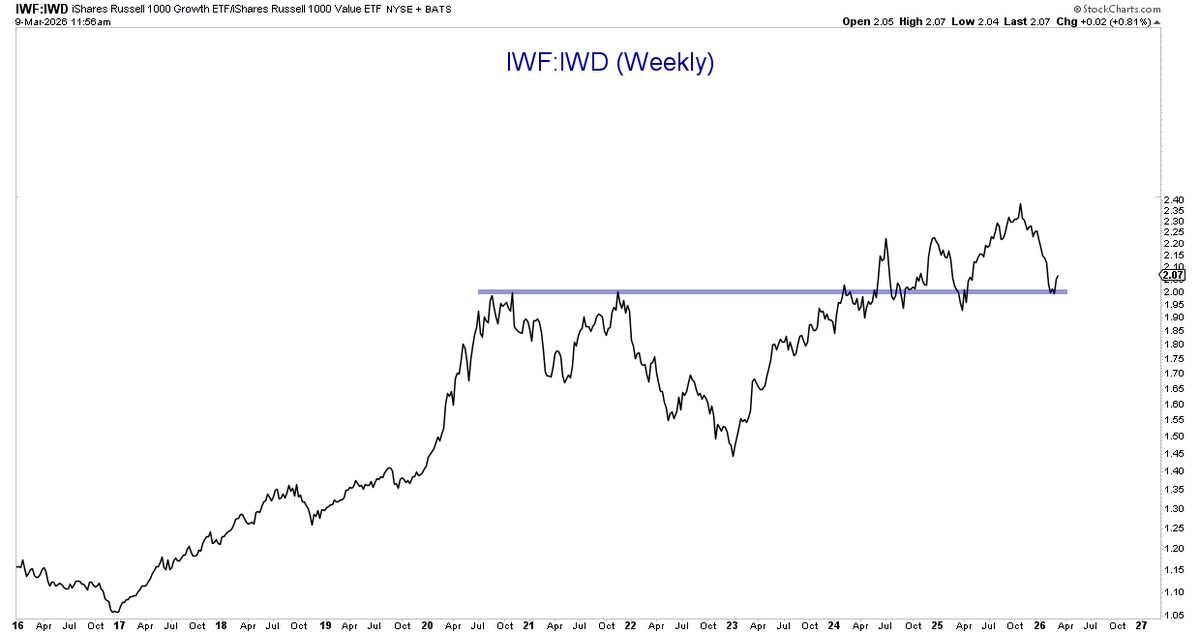
Growth vs. Value is finding support at a multi-year polarity level.
See the entire post from Brian G.
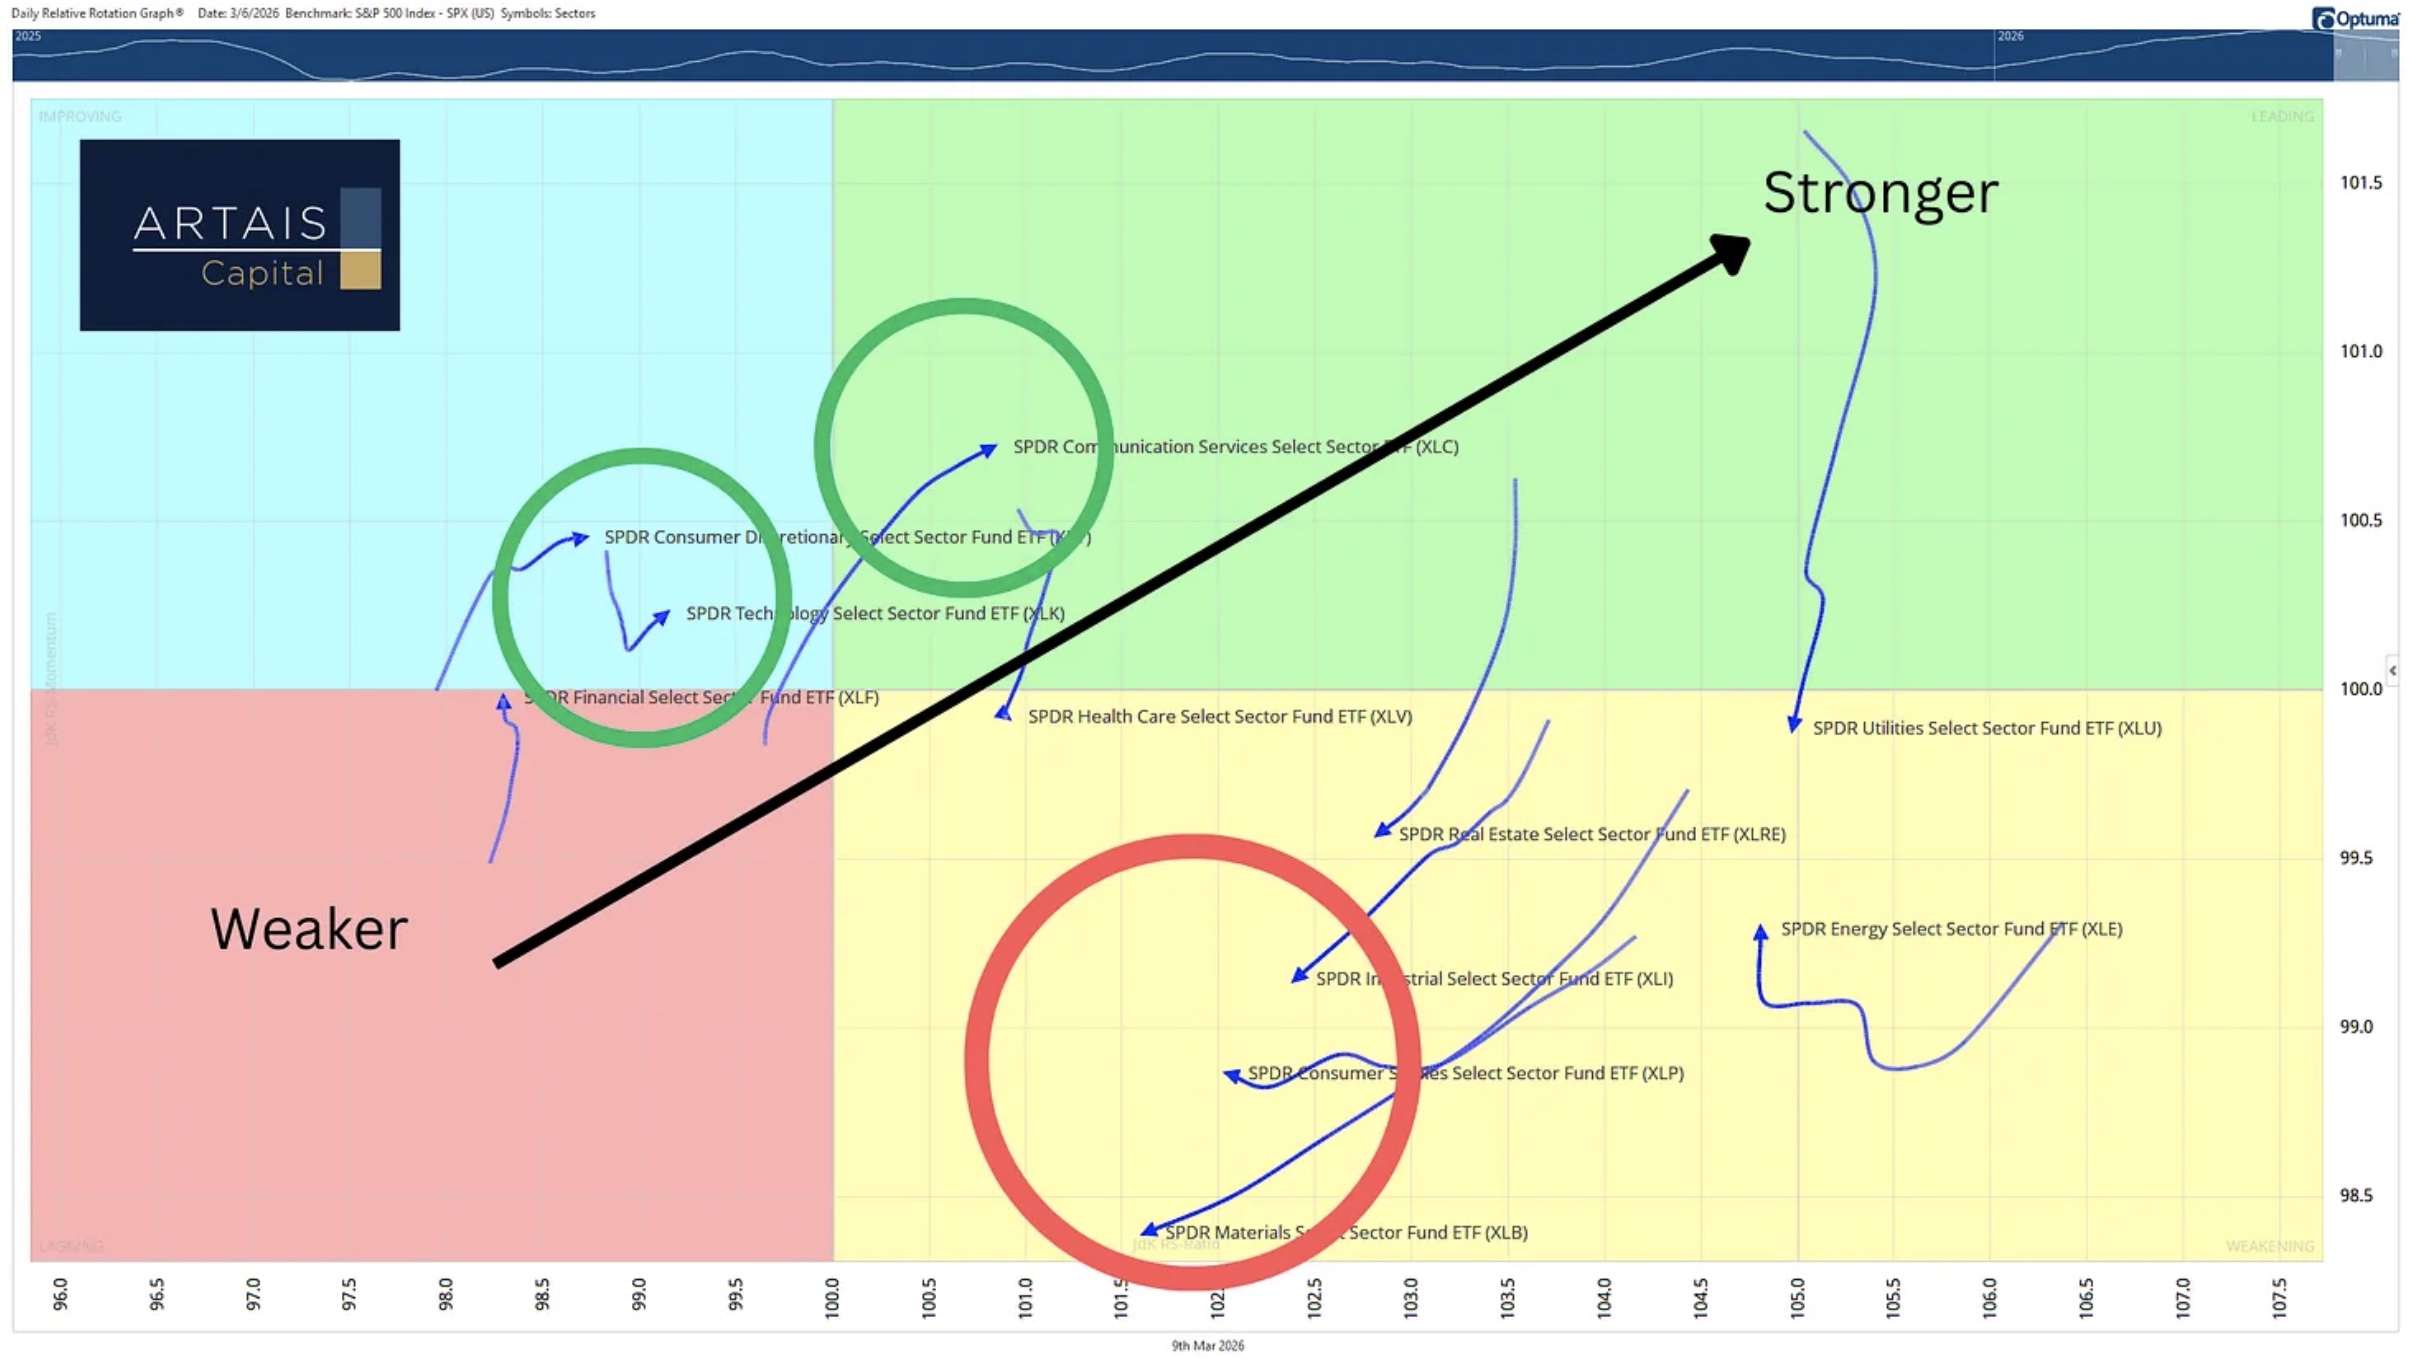
The Relative Rotation Graph shows rotation favoring Technology and Communications, while value sectors like Consumer Staples and Materials rotate toward weakness.
Explore the full breakdown from John Rothe.
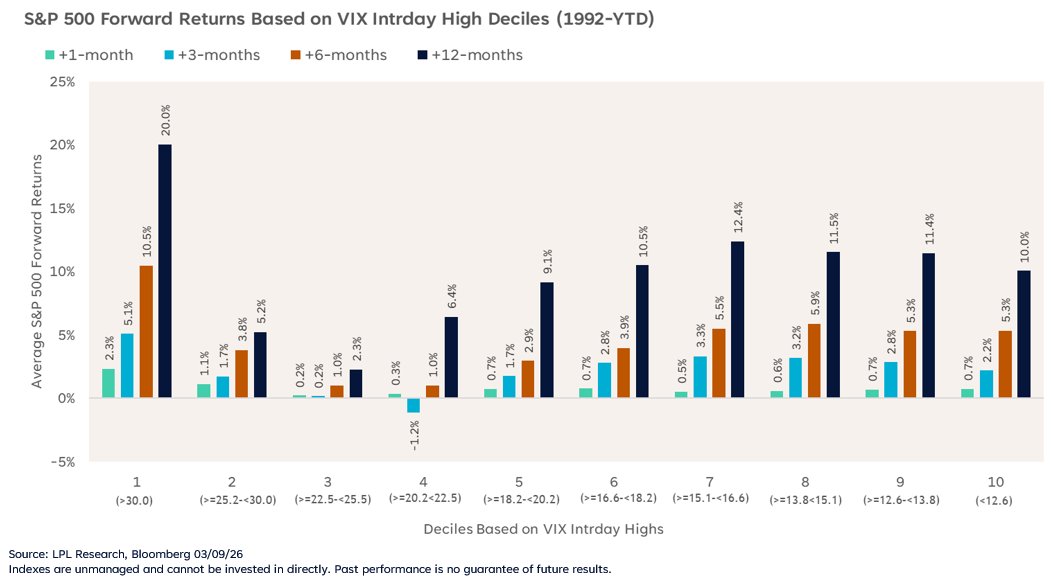
The VIX spiked to 35 overnight, and similar readings have coincided with above-average forward S&P 500 returns.
Access the latest note from Adam Turnquist and Jeffrey Buchbinder.
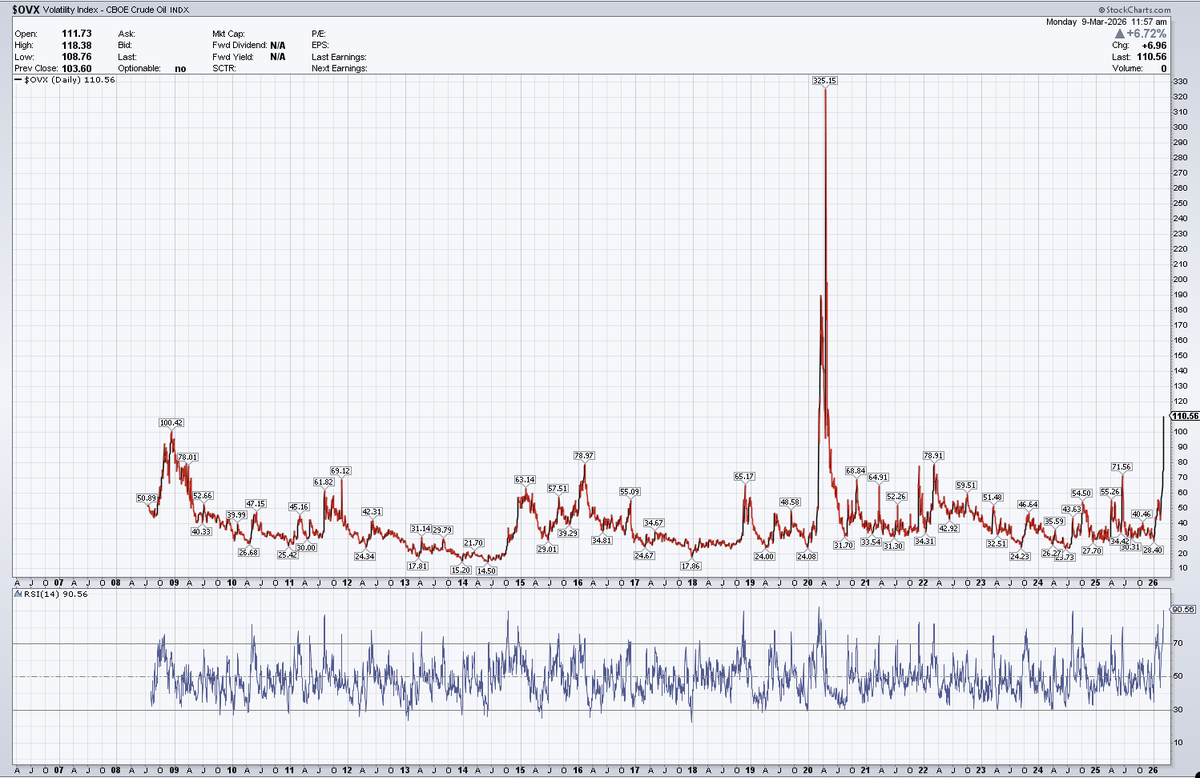
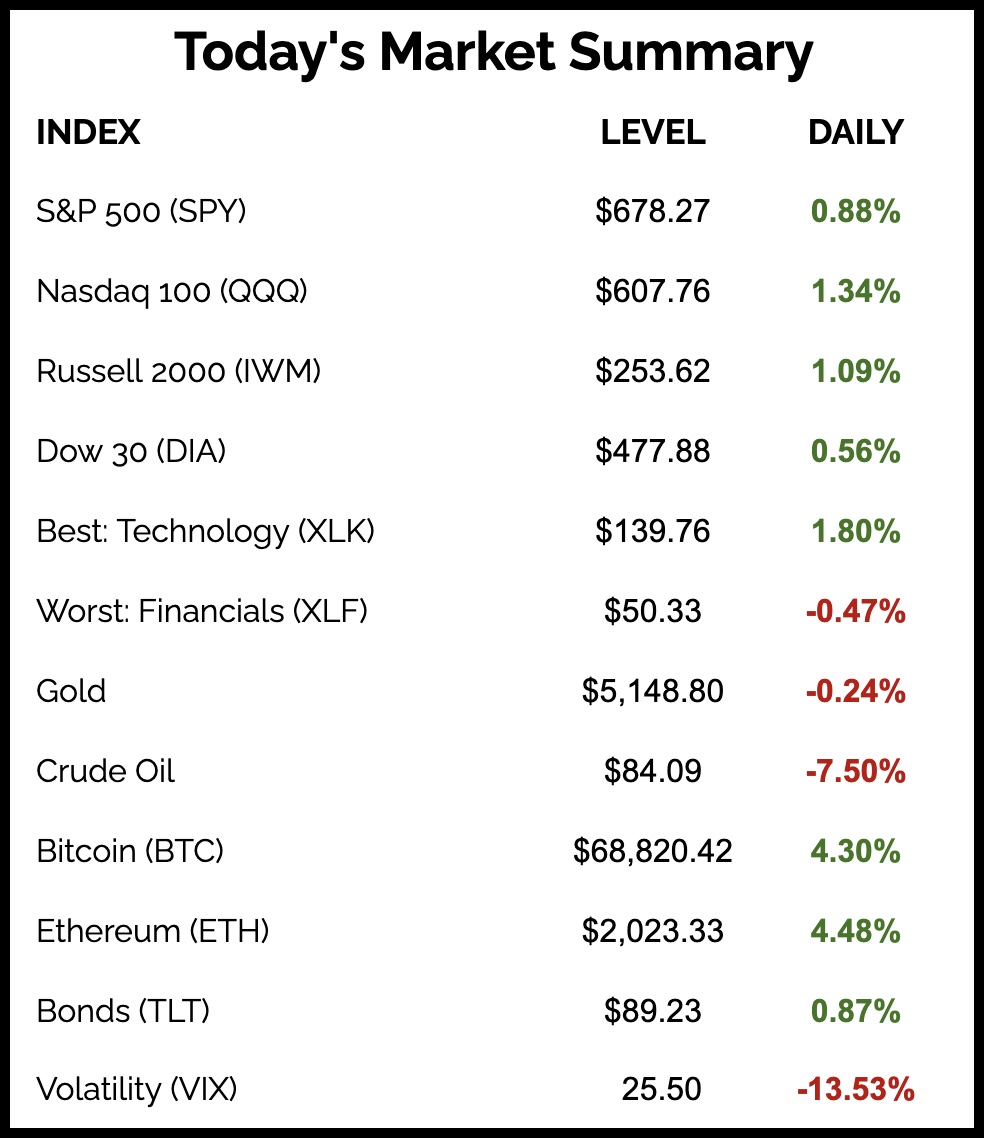
The oil market hasn’t seen this level of volatility since COVID.
See the whole tweet from Connor Bates.
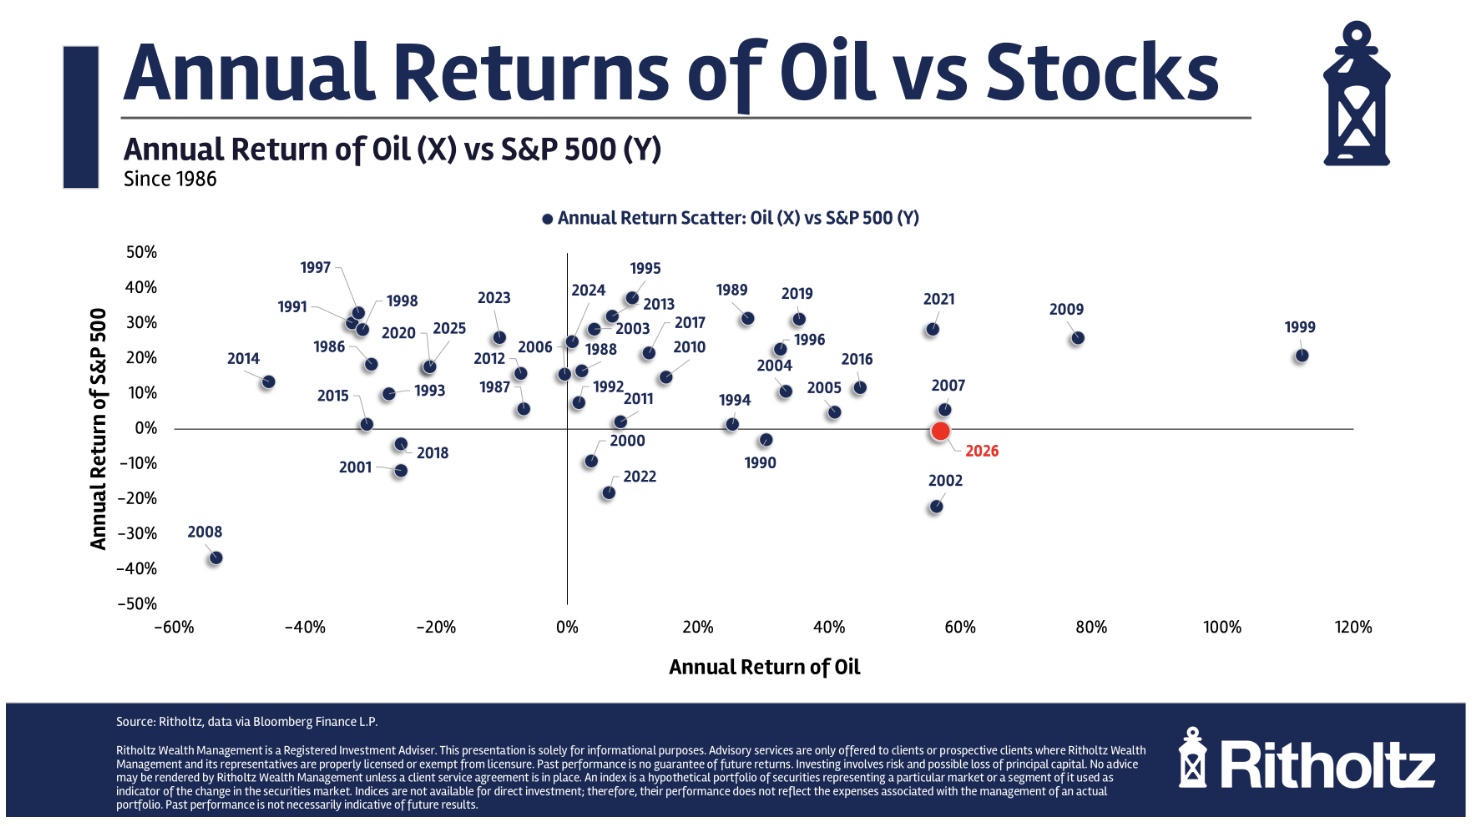
Stocks have tended to perform better when oil prices are rising rather than declining.
Read the entire article from Ben Carlson.
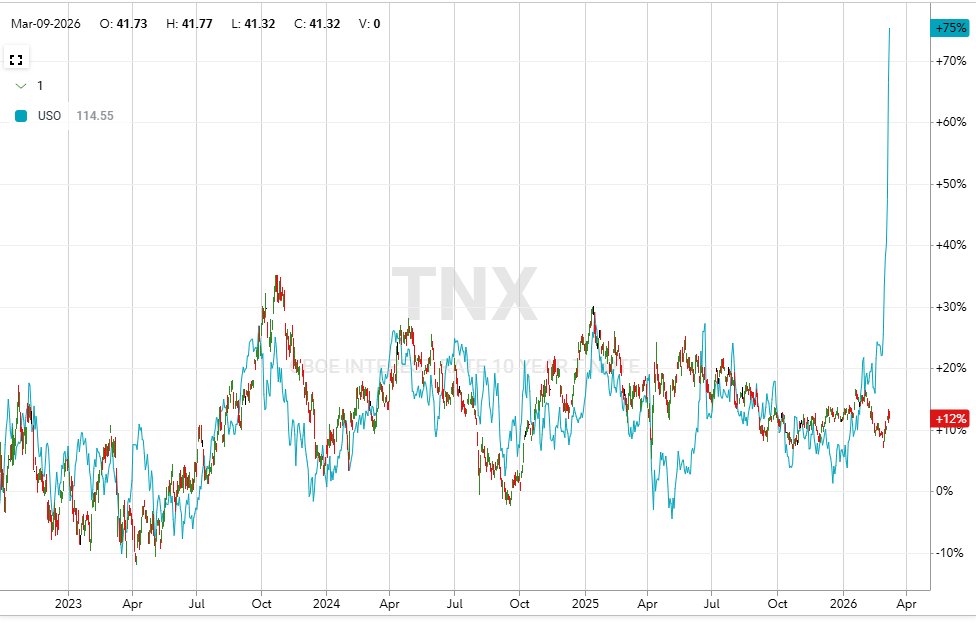
Despite the historic surge in oil, yields have stayed relatively flat.
Check out the full post from Reformed Trader.
The Chart Report curates best-in-class technical analysis from across the web.
If you’d like to share a chart or just say hello, email us at [email protected]