The Tightest Start to the Year in History 📈 The Chart Report

Chart of the Day
🏆 Today's Chart of the Day was shared by Macro Charts.
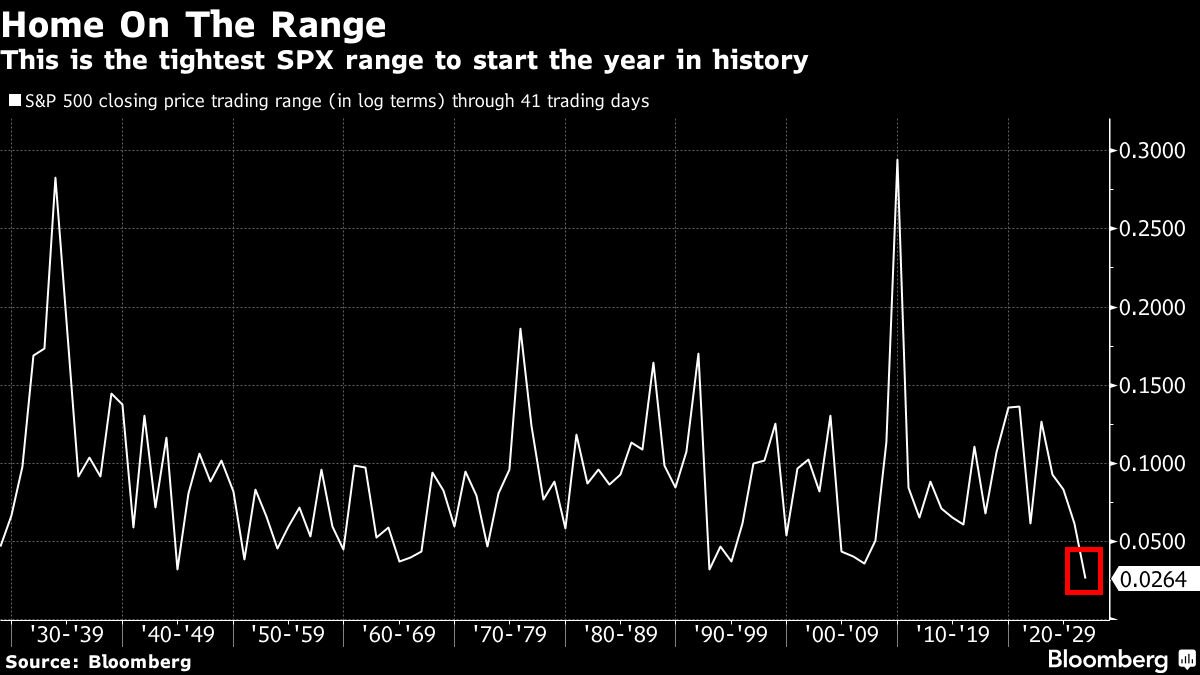
The S&P 500 has begun the year trading within its tightest range in history.
Over the past few months, the index has remained confined to roughly a 4% window, quietly building pressure for the next major directional move.
While the index itself hasn’t gone far, there's been plenty of action beneath the surface, with several sectors posting historic starts to the year.
The Takeaway: The S&P 500 is locked in an extremely tight range, setting the stage for a significant move once this compression resolves.
More Great Charts
Bulls generally want to see tight consolidations rather than patterns that stretch out over many months.
"Beware the Ides of March."
Read the full analysis from Mike Zaccardi.
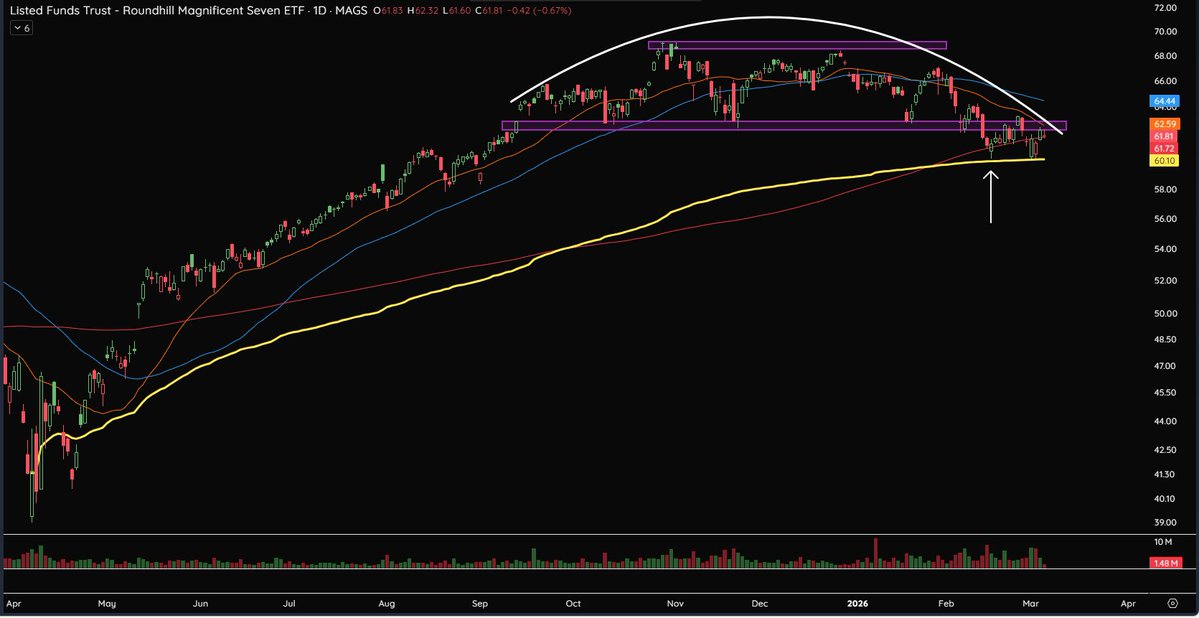
If the Mag Seven loses its April low AVWAP near $60, the group could begin to weigh on the broader market.
Check out the whole tweet from Jack.
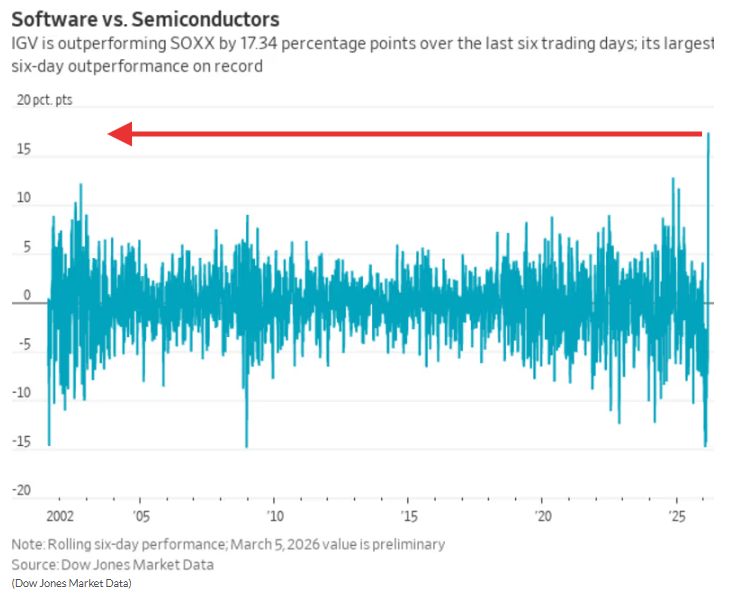
Over the last six sessions, software has outperformed semiconductors by 17.3%, the largest spread on record.
View the complete post from Neil Sethi.
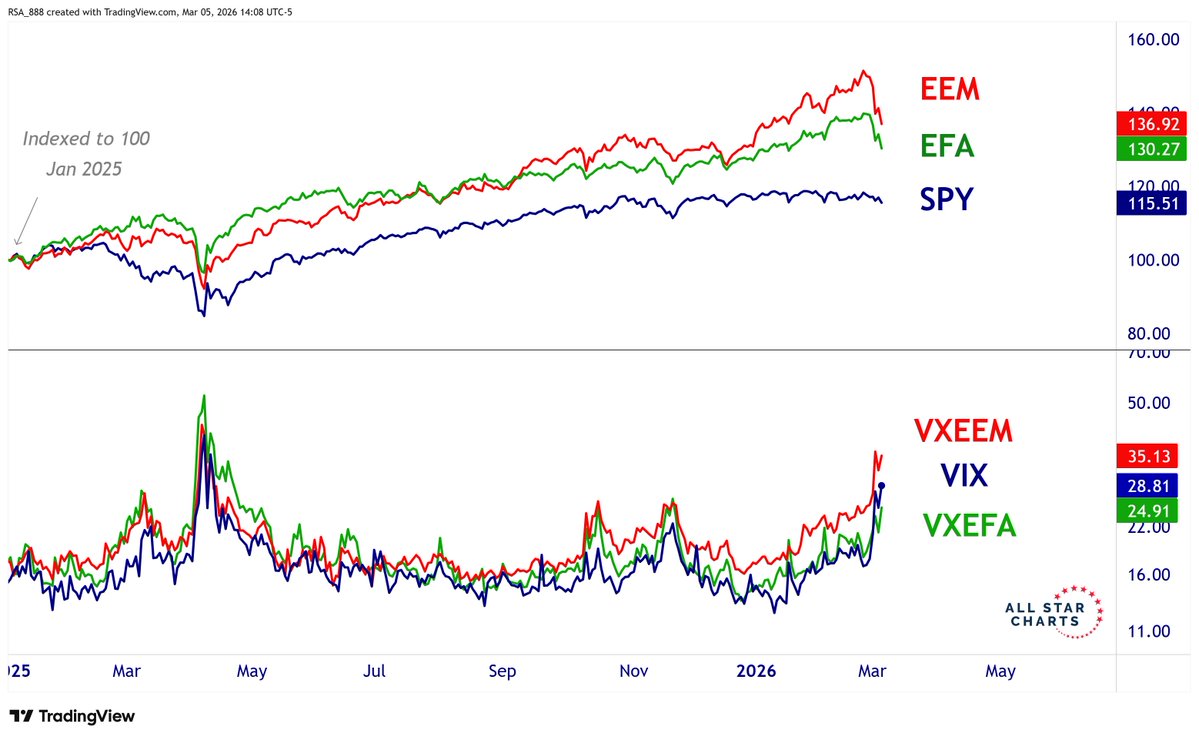
Volatility spikes across SPY, EEM, and EFA have reached their largest levels since the April lows.
See the entire tweet from Ricardo Sarraf.
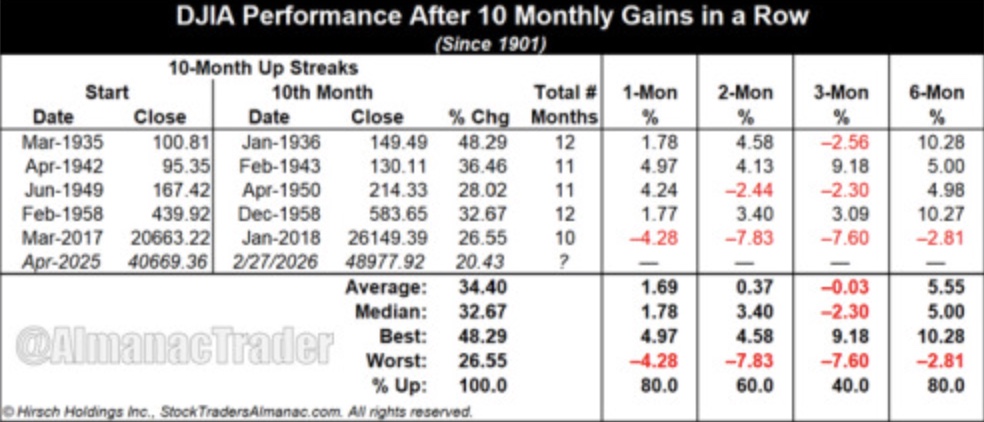
The Dow Jones Industrial Average has logged a 10-month winning streak.
After similar streaks since 1901, the index moved higher the following month 80% of the time with an average gain of 1.69%.
Access the full breakdown from Jeff Hirsch.
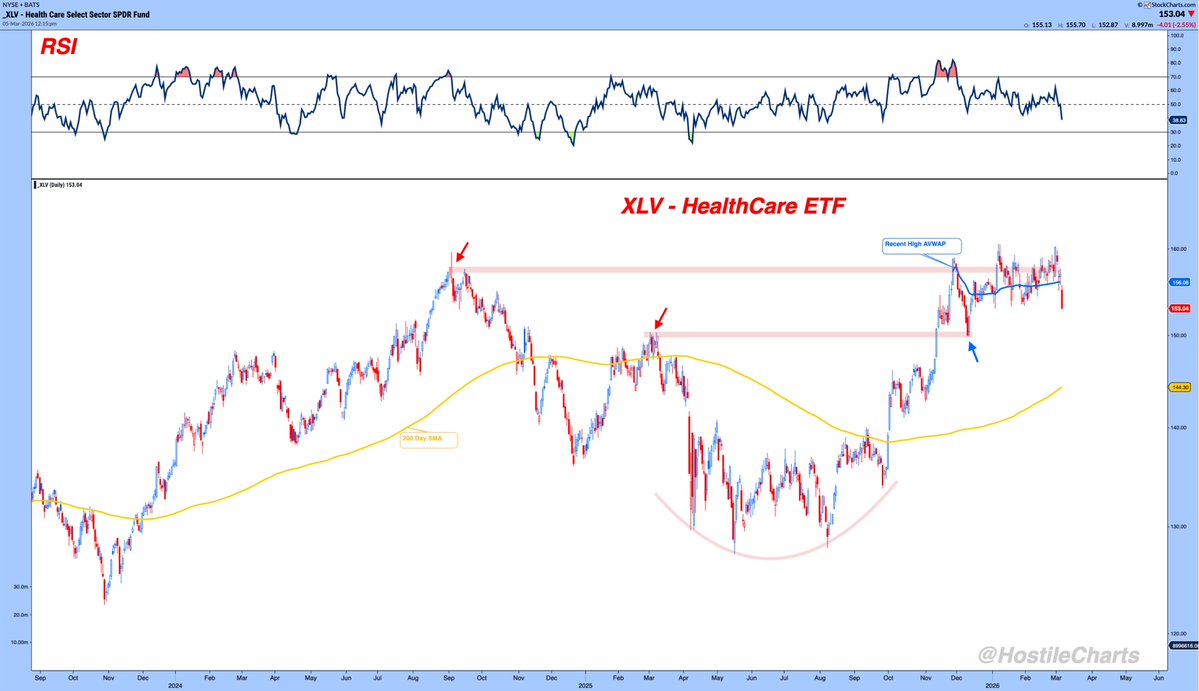
The Health Care sector is experiencing a failed breakout at its prior all-time highs.
View the whole post from Larry Thompson.
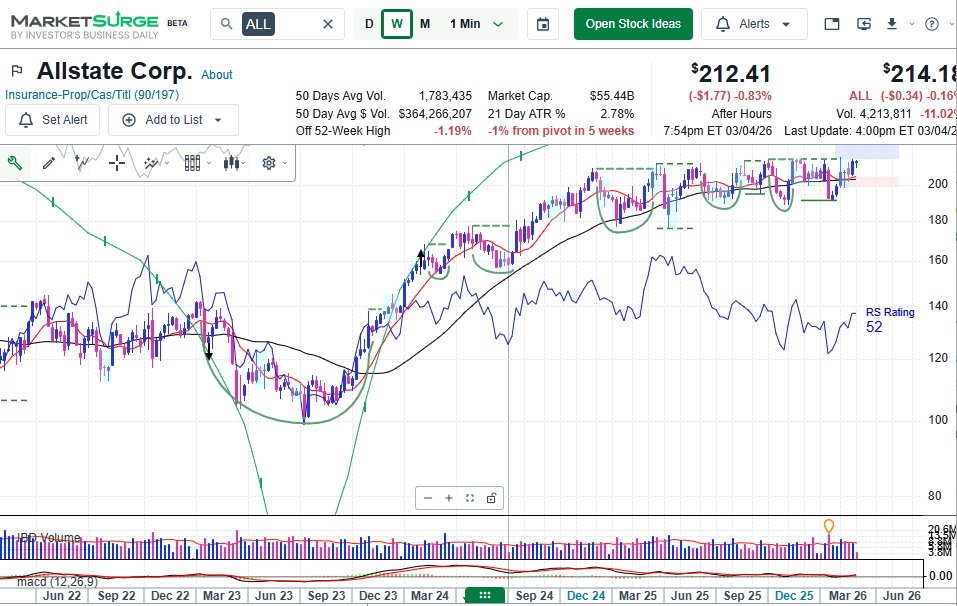
Property and casualty insurers like Allstate have traded in a tight range for roughly 16 months.
Examine the complete take from Mark Newton.
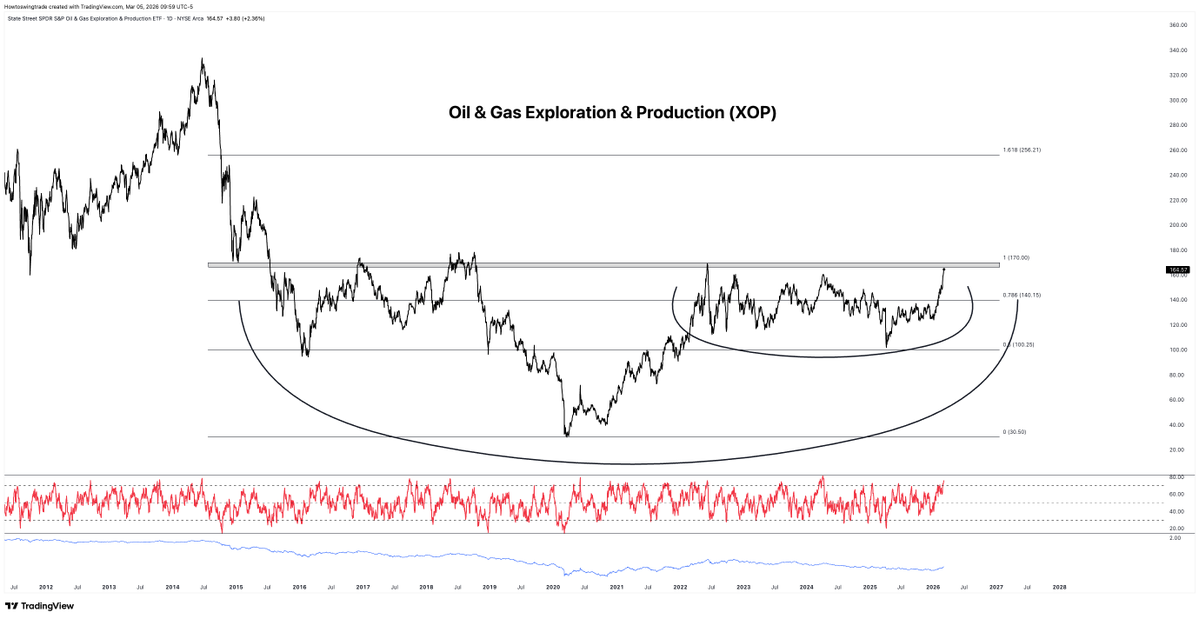
The Oil & Gas Exploration & Production ETF is attempting to complete a massive decade long reversal pattern.
Check out the full post from Hamilton.
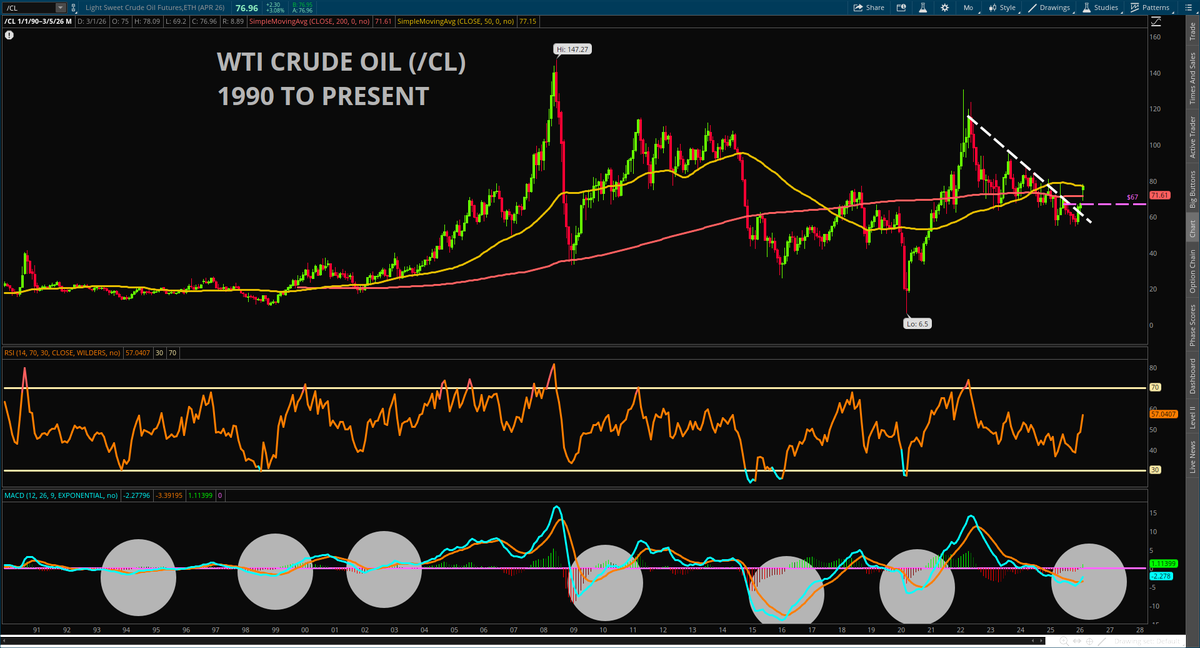
Crude Oil has triggered a bullish MACD crossover on the monthly chart.
Long-term signals like this have historically led to bull cycles in the months ahead.
See the entire tweet from Kevin Green.
The Chart Report curates best-in-class technical analysis from across the web.
If you’d like to share a chart or just say hello, email us at [email protected]