Software is Back to the Panic Zone 📈 The Chart Report

Chart of the Day
🏆 Today's Chart of the Day was shared by Ricardo Sarraf.
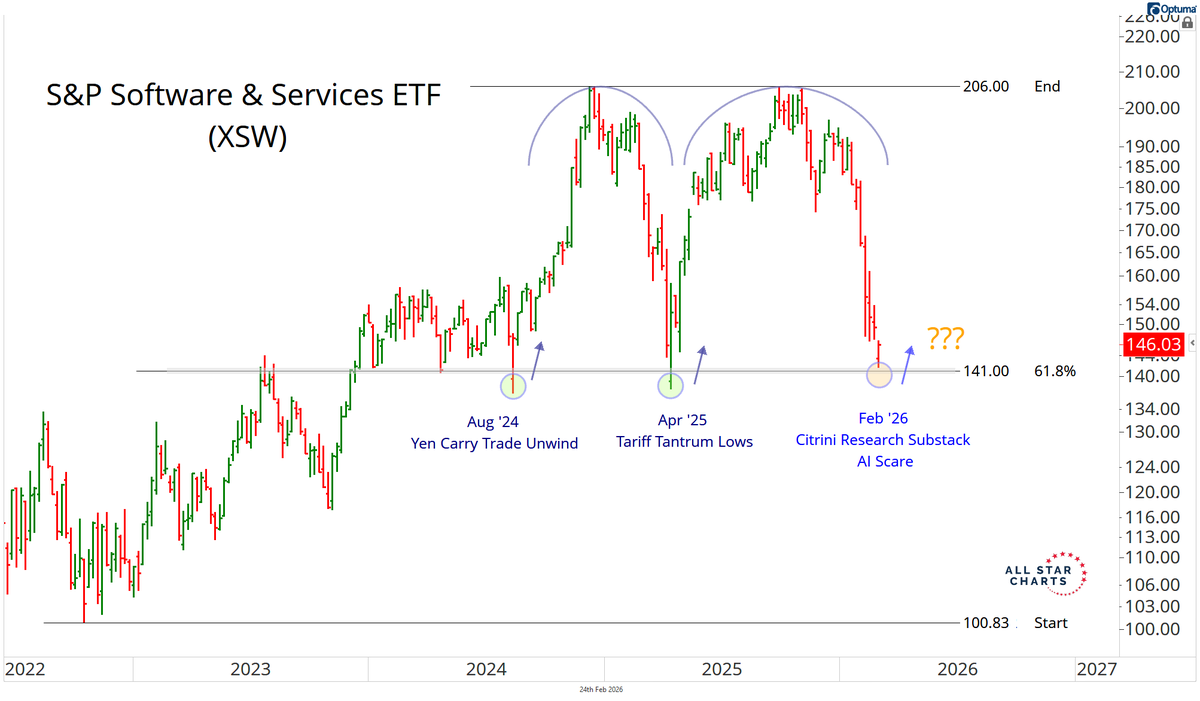
The Equal Weight Software ETF ($XSW) has pulled back into a notable level of interest.
The ETF just tagged the 61.8% retracement of its cycle low to high advance, which is the same area that marked the Yen carry unwind lows in August 2024 and the Tariff Tantrum washout in April 2025.
Each prior visit sparked meaningful upside reversals, making it a logical level for buyers to potentially step back in.
The Takeaway: Software is testing a significant support level that has marked the past two panic lows.
More Great Charts
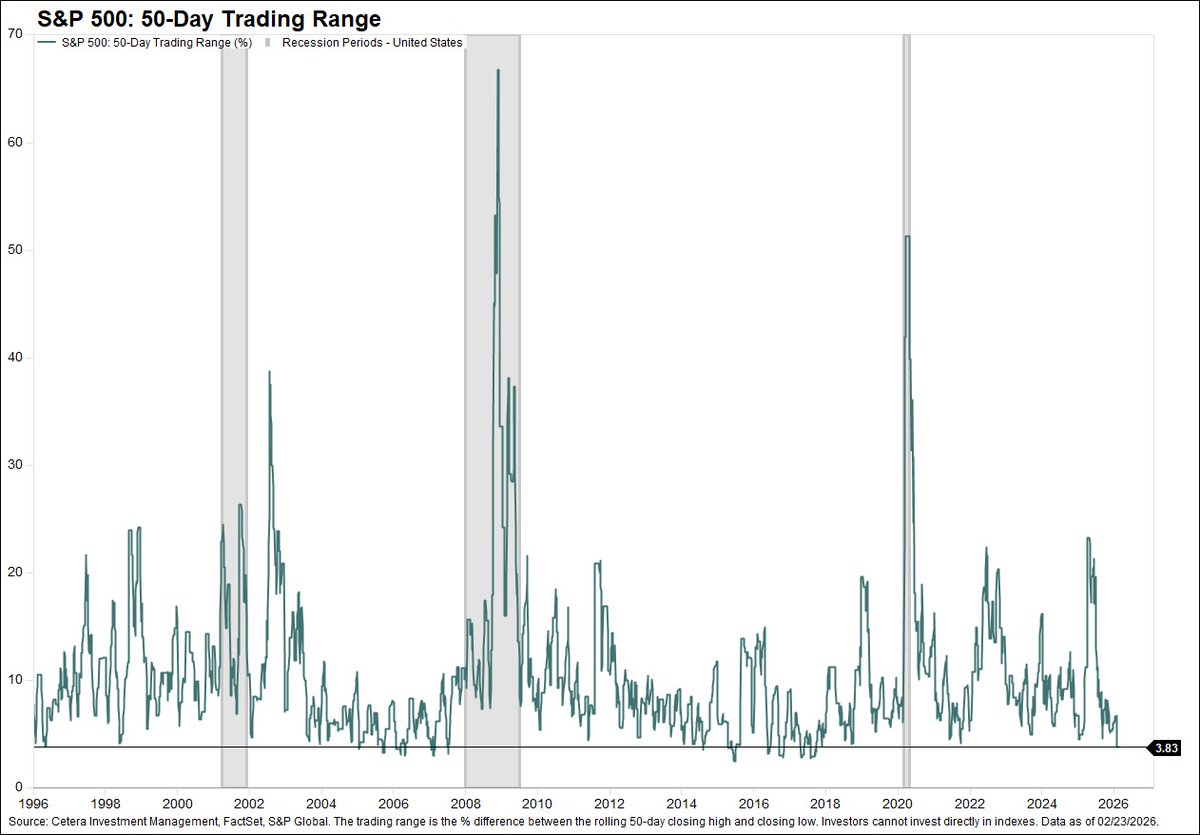
The S&P 500 has been confined to a tight range over the past 50 trading days, its narrowest stretch since September 2017.
See the full tweet from Cetera Investment Management.
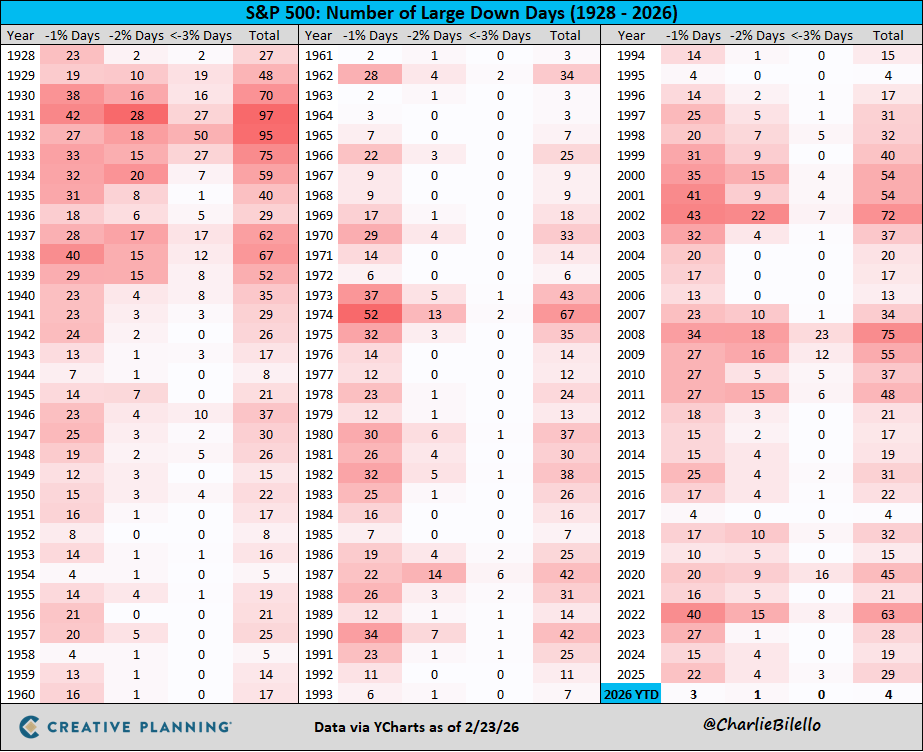
Yesterday, The S&P 500 declined 1%, marking its fourth daily loss of more than 1% this year.
Volatility of this magnitude is normal, and the average year produces roughly 29 such declines.
View the entire post from Charlie Bilello.
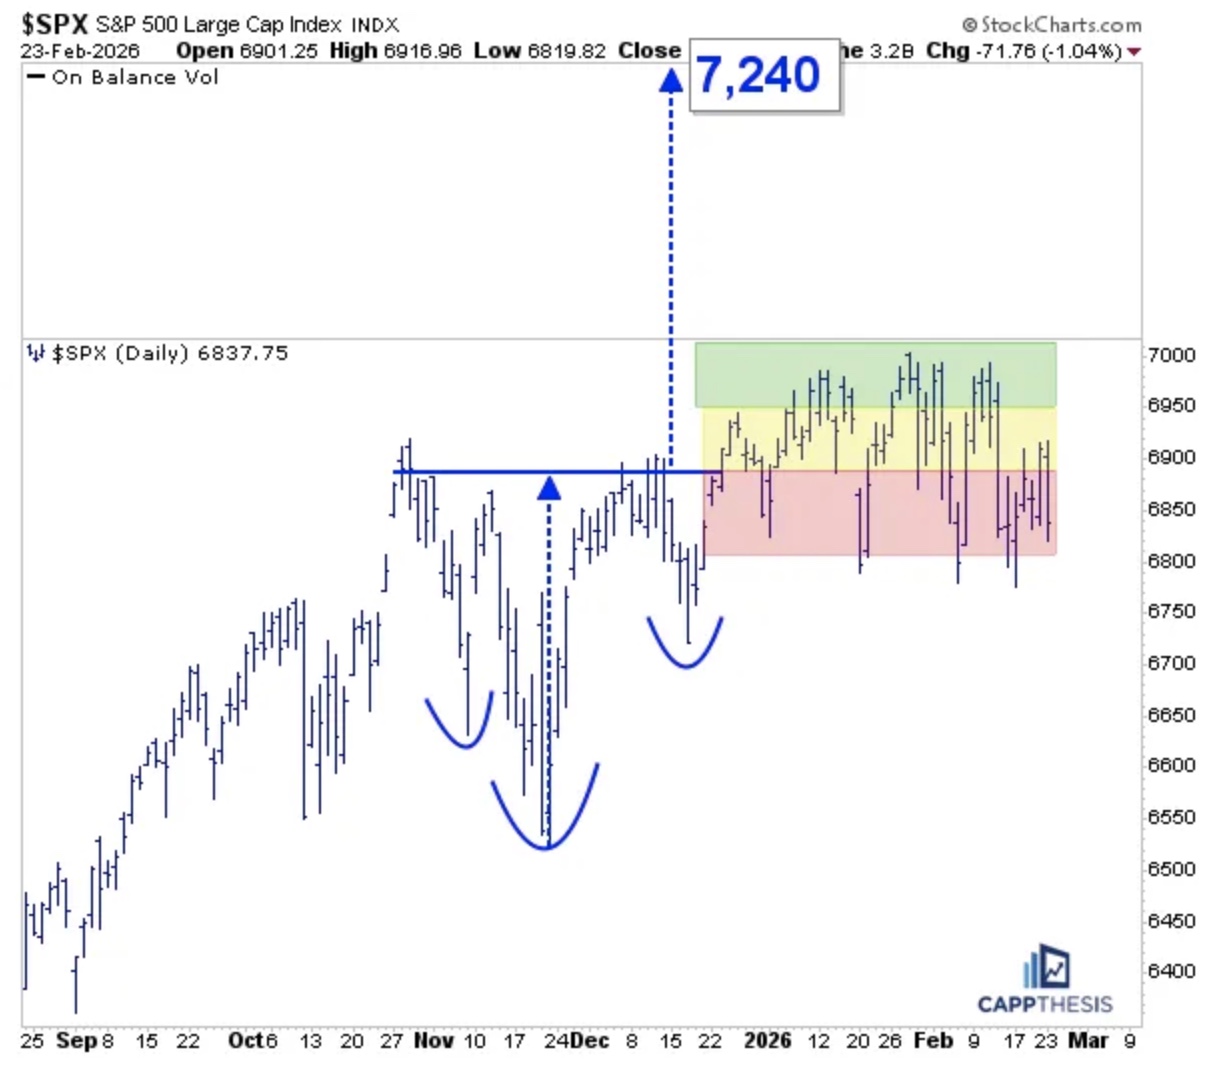
If the market delivers strong bullish follow-through on a confirmed breakout, the 7,240 upside objective remains viable.
Access the detailed breakdown from Frank Cappelleri.
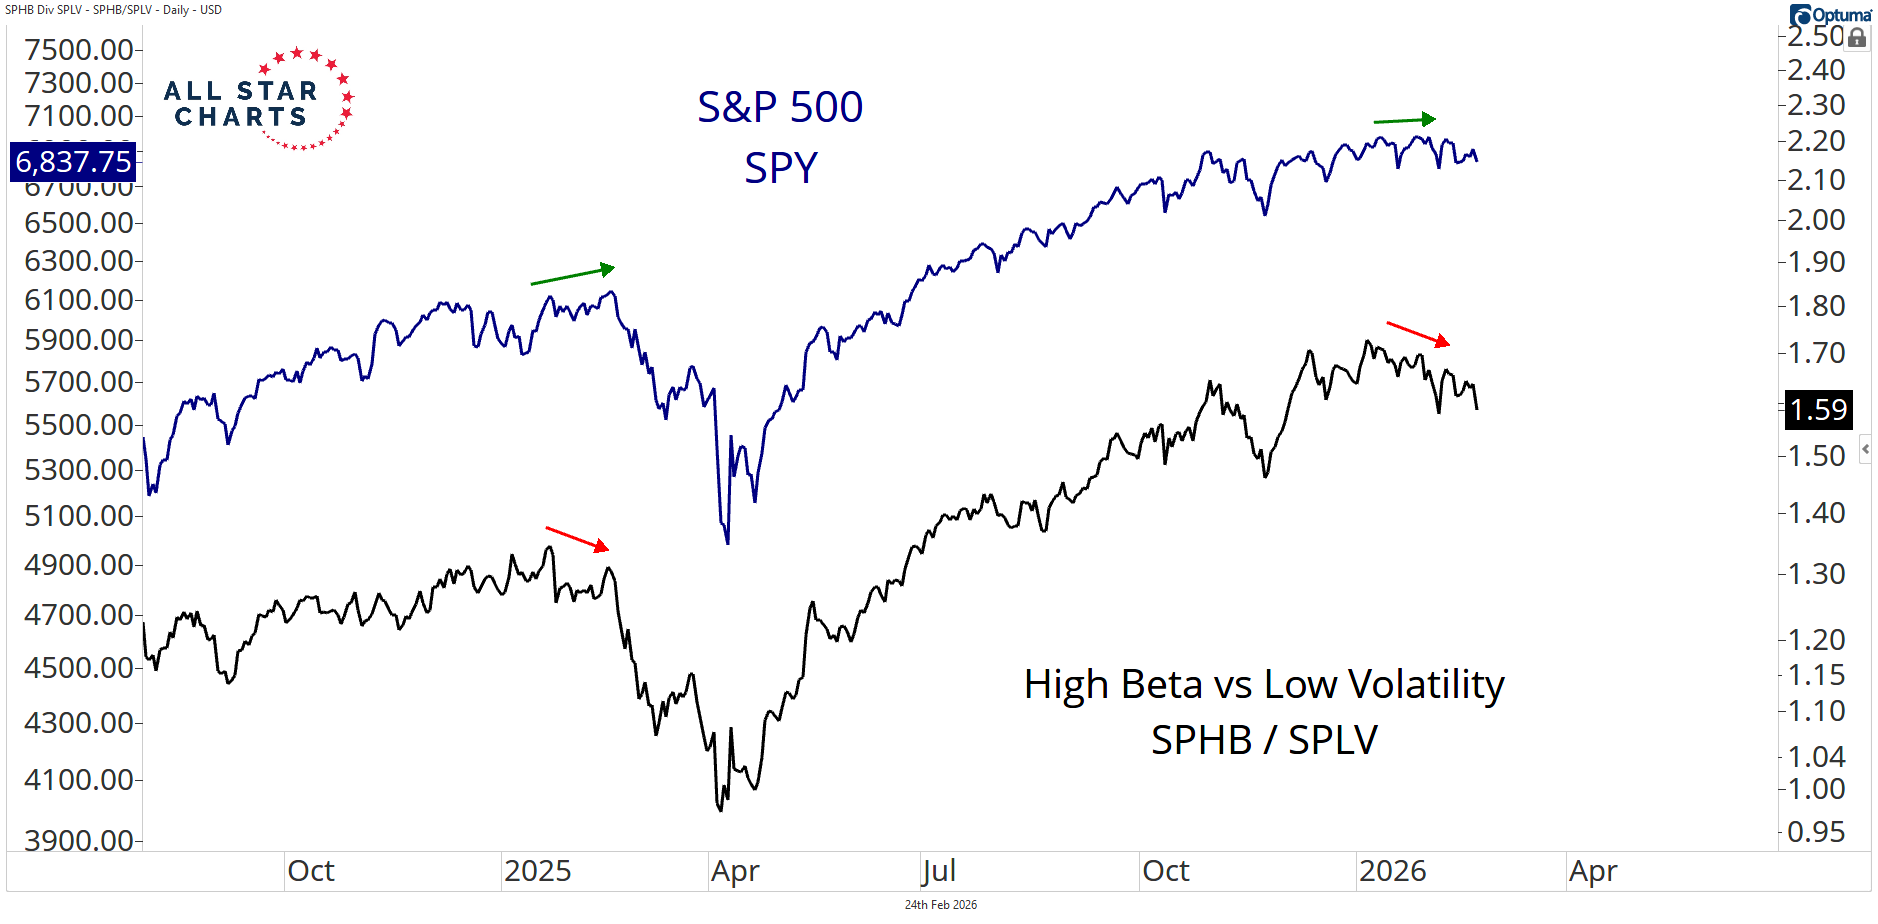
We're seeing high beta versus low volatility diverge from the S&P 500.
The last instance was right before the Liberation Day selloff.
Read the full analysis from Alfonso De Pablos.
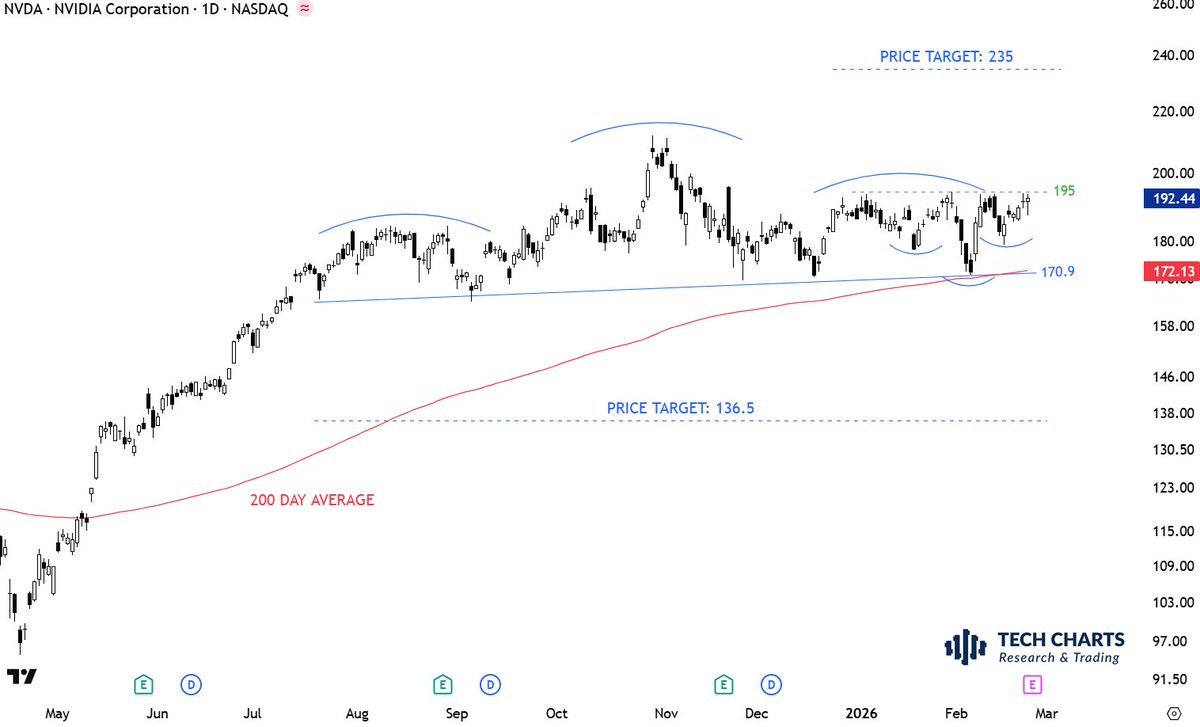
Two interlocking patterns are developing in Nvidia: a multi-month head and shoulders top and a smaller multi-week inverse head and shoulders bottom.
Examine the complete tweet from Aksel Kibar.
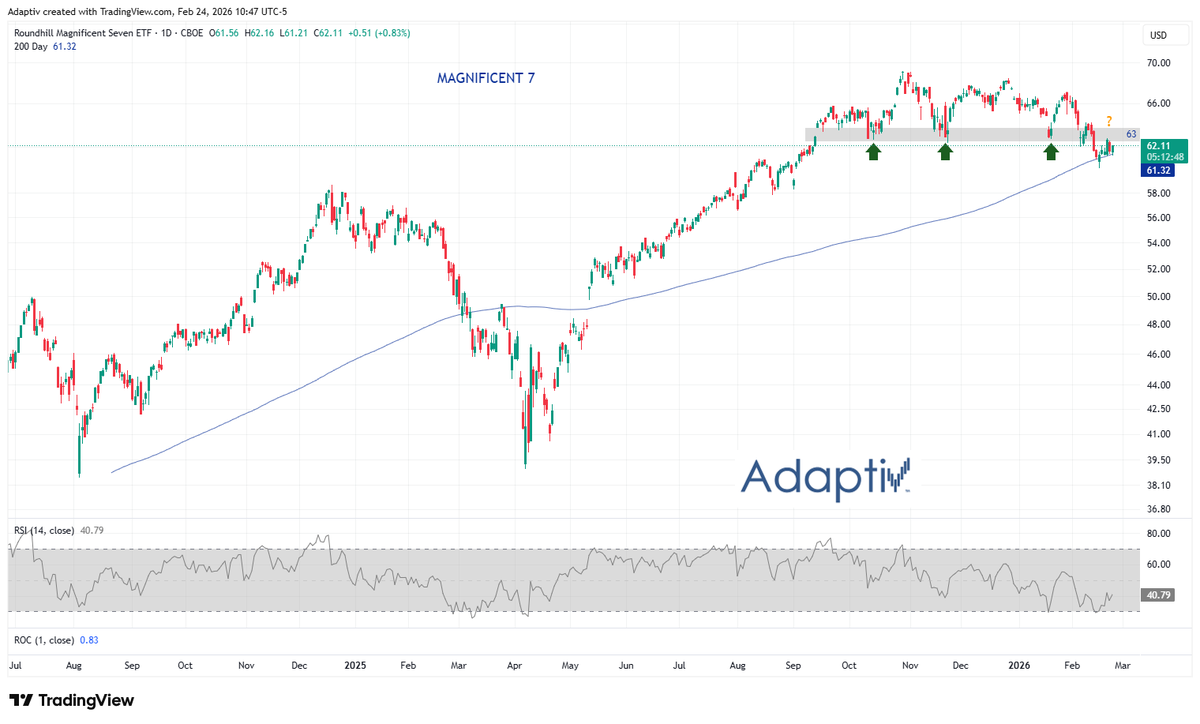
The Mag Seven ETF is testing its 200-day moving average while sitting just beneath former support near $63.
This remains a pivotal area.
David Zarling discusses the implications in the latest episode of The Weekly Trend.
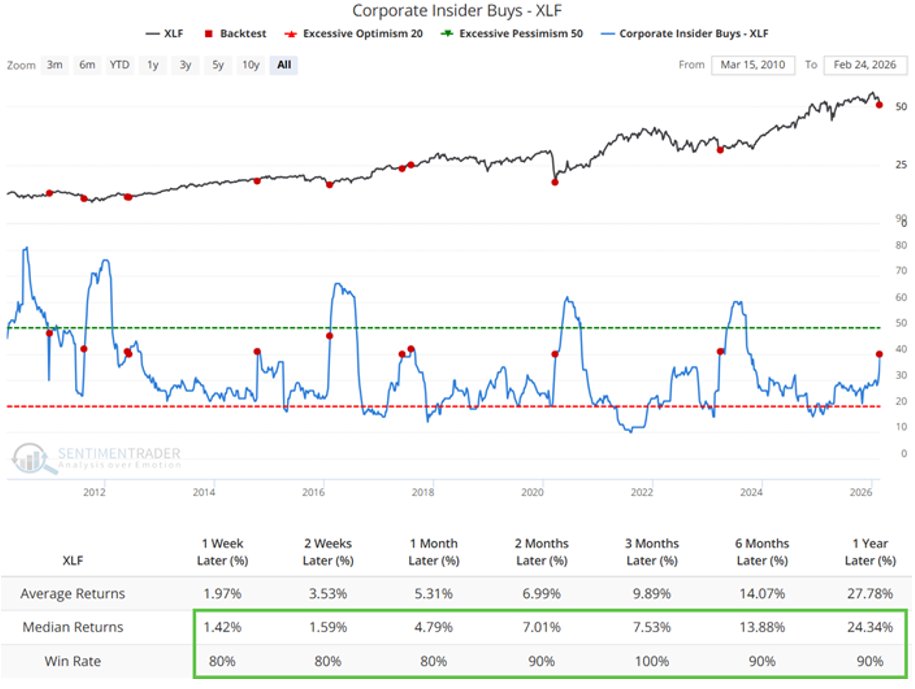
Insiders within the Financial sector have been buying into recent weakness, and historically, they have a pretty good track record.
Check out the full post from Jay Kaeppel.
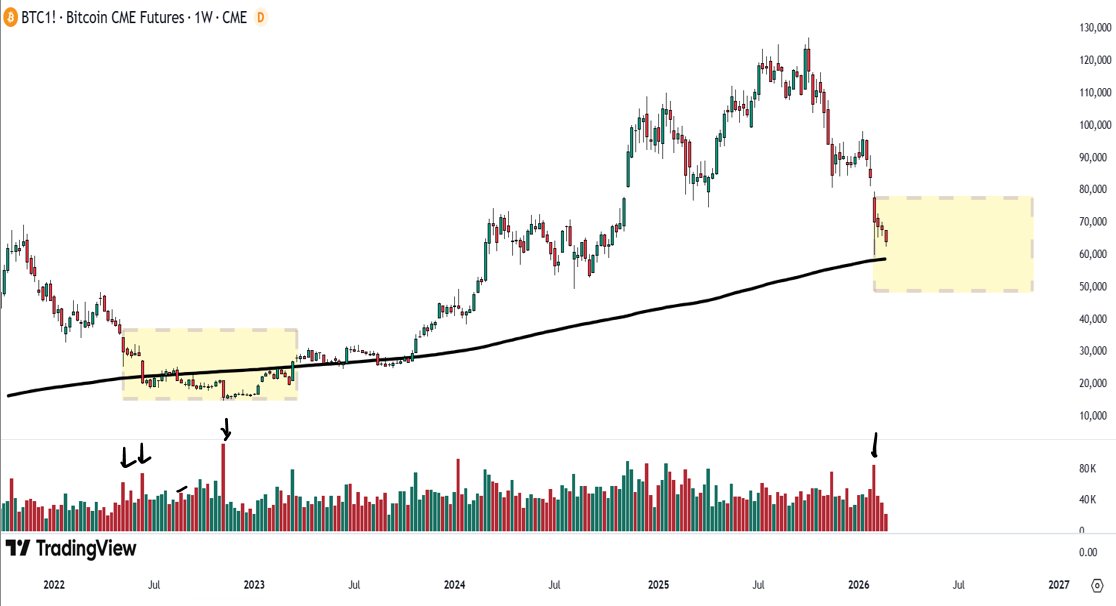
Bitcoin is currently resting on the 200-week simple moving average — a level that has repeatedly served as major structural support.
Explore the entire tweet from Wyckoff Analytics.
The Chart Report curates best-in-class technical analysis from across the web.
If you’d like to share a chart or just say hello, email us at [email protected]