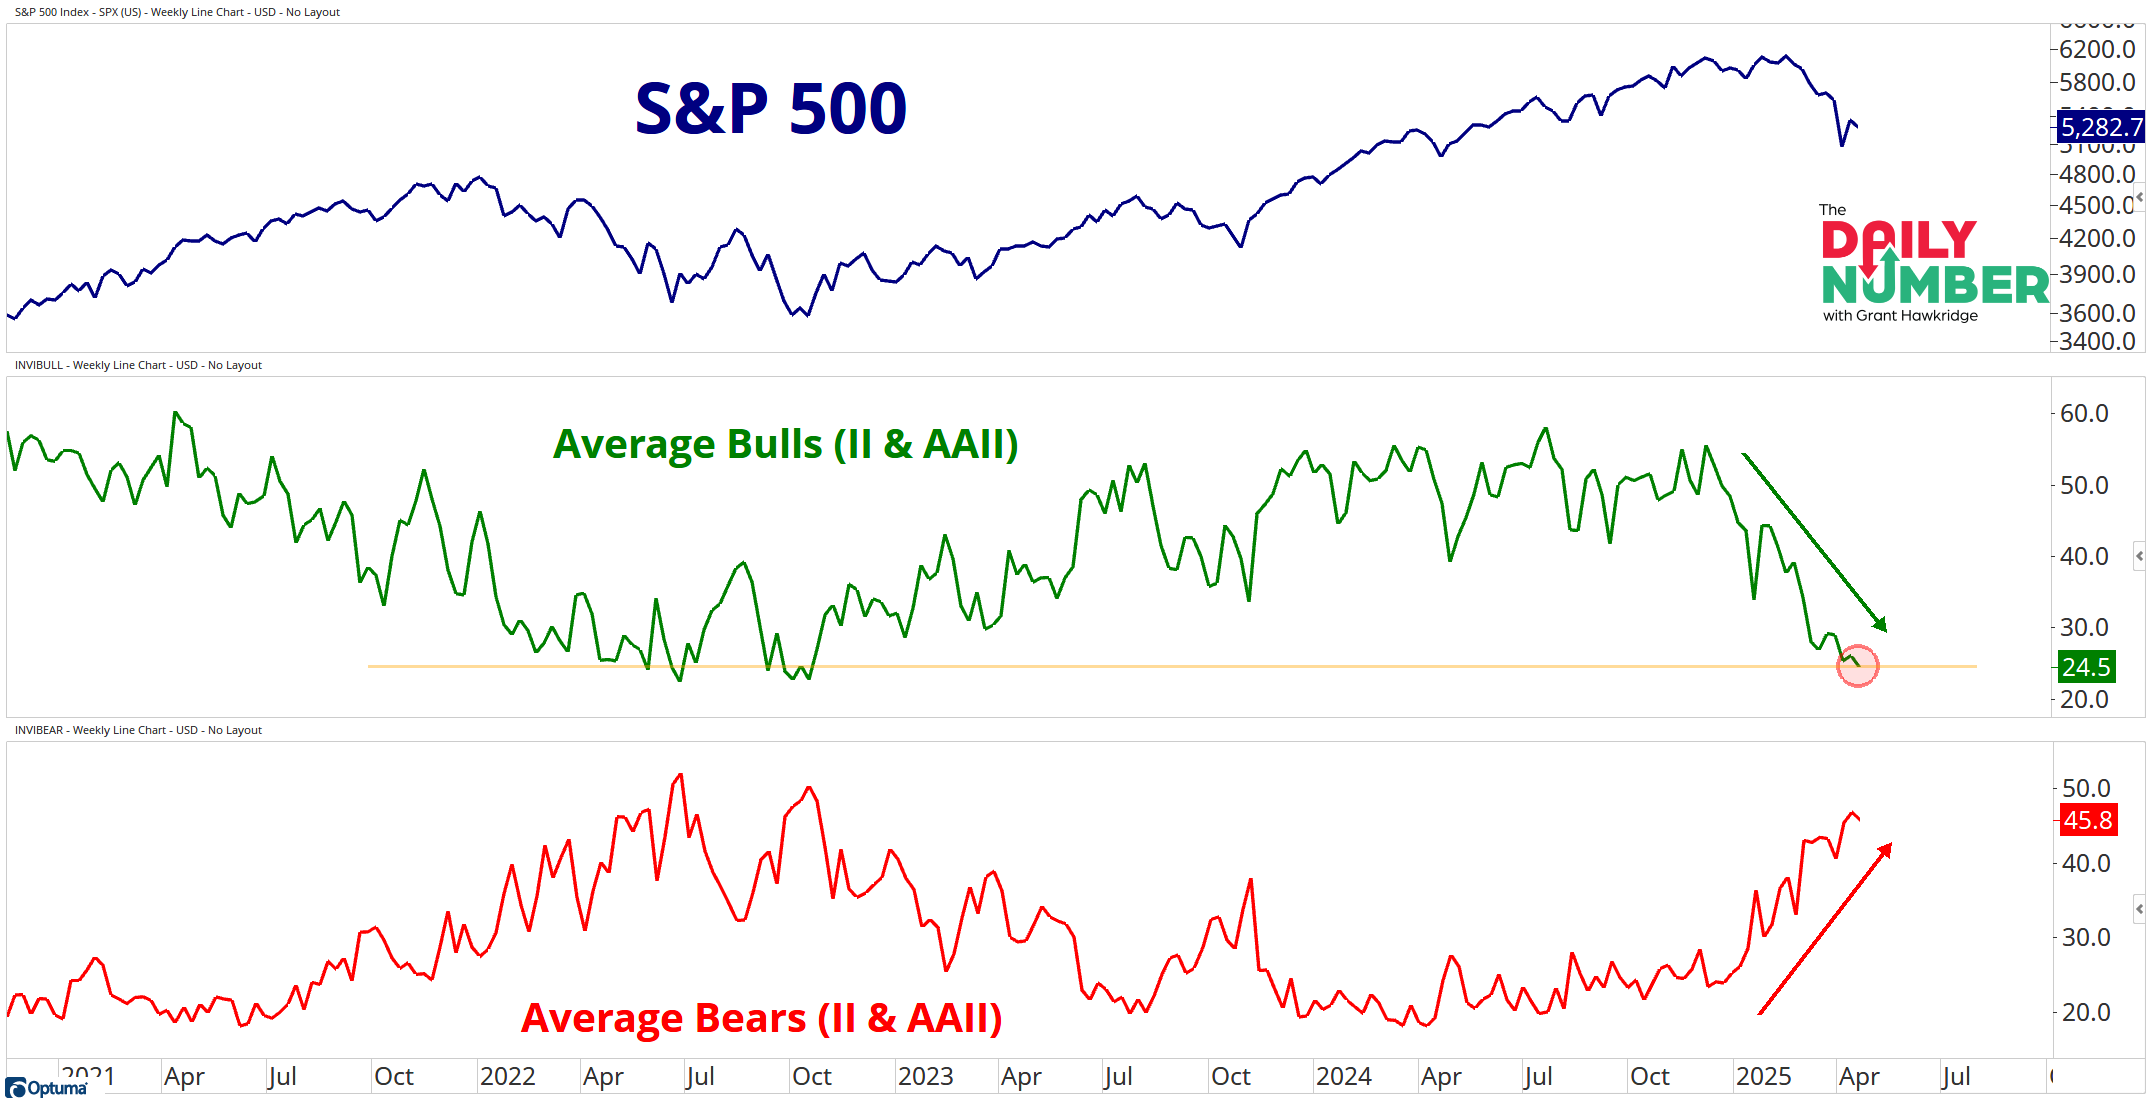
The average bulls have fallen to 24.5, the lowest level since the lows of the ‘cost of living crisis’ in October 2022.
Here’s the chart:
Let's break down what the chart shows:
The blue line in the top panel represents the price of the S&P 500 index.
The green line in the middle panel shows the average bulls from the Investors Intelligence (II) and the American Association of Individual Investors (AAII).
The red line in the bottom panel shows the average bears from the II and the AAII.
The Takeaway: You need bulls in bull markets to buy stocks...That's just math.
And today we're seeing the opposite of that.
The average number of bulls has dropped to its lowest level since October 2022, while the average number of bears has reached its highest level since that same month.
This tells me that optimism in the market has vanished, and the recent volatility has really led to a notable level of pessimism.
With bullish sentiment at such low levels and bearish sentiment at highs, could these levels in sentiment now act as a tailwind for risk assets instead of a headwind? Maybe…
While it's possible for sentiment to become even more bearish and prices to decline further, such extreme readings might suggest that we're approaching a tradable low in the market.
Grant Hawkridge | Chief Aussie Operator, All Star Charts
PS:If you missed Steve's live event on Friday, He walked through some of his best Put trades from the last few weeks, how he found them, and what kind of trades he is looking for right now.Check it out.
If you find my content valuable, I would greatly appreciate it if you could share it with your friends, family, and colleagues. Your help in spreading the word is invaluable in supporting our work. Thank you to all of you who share!