10 out of the 11 sectors in the S&P 500 are currently above their 50-day moving average.
Here’s the chart:
Let's break down what the chart shows:
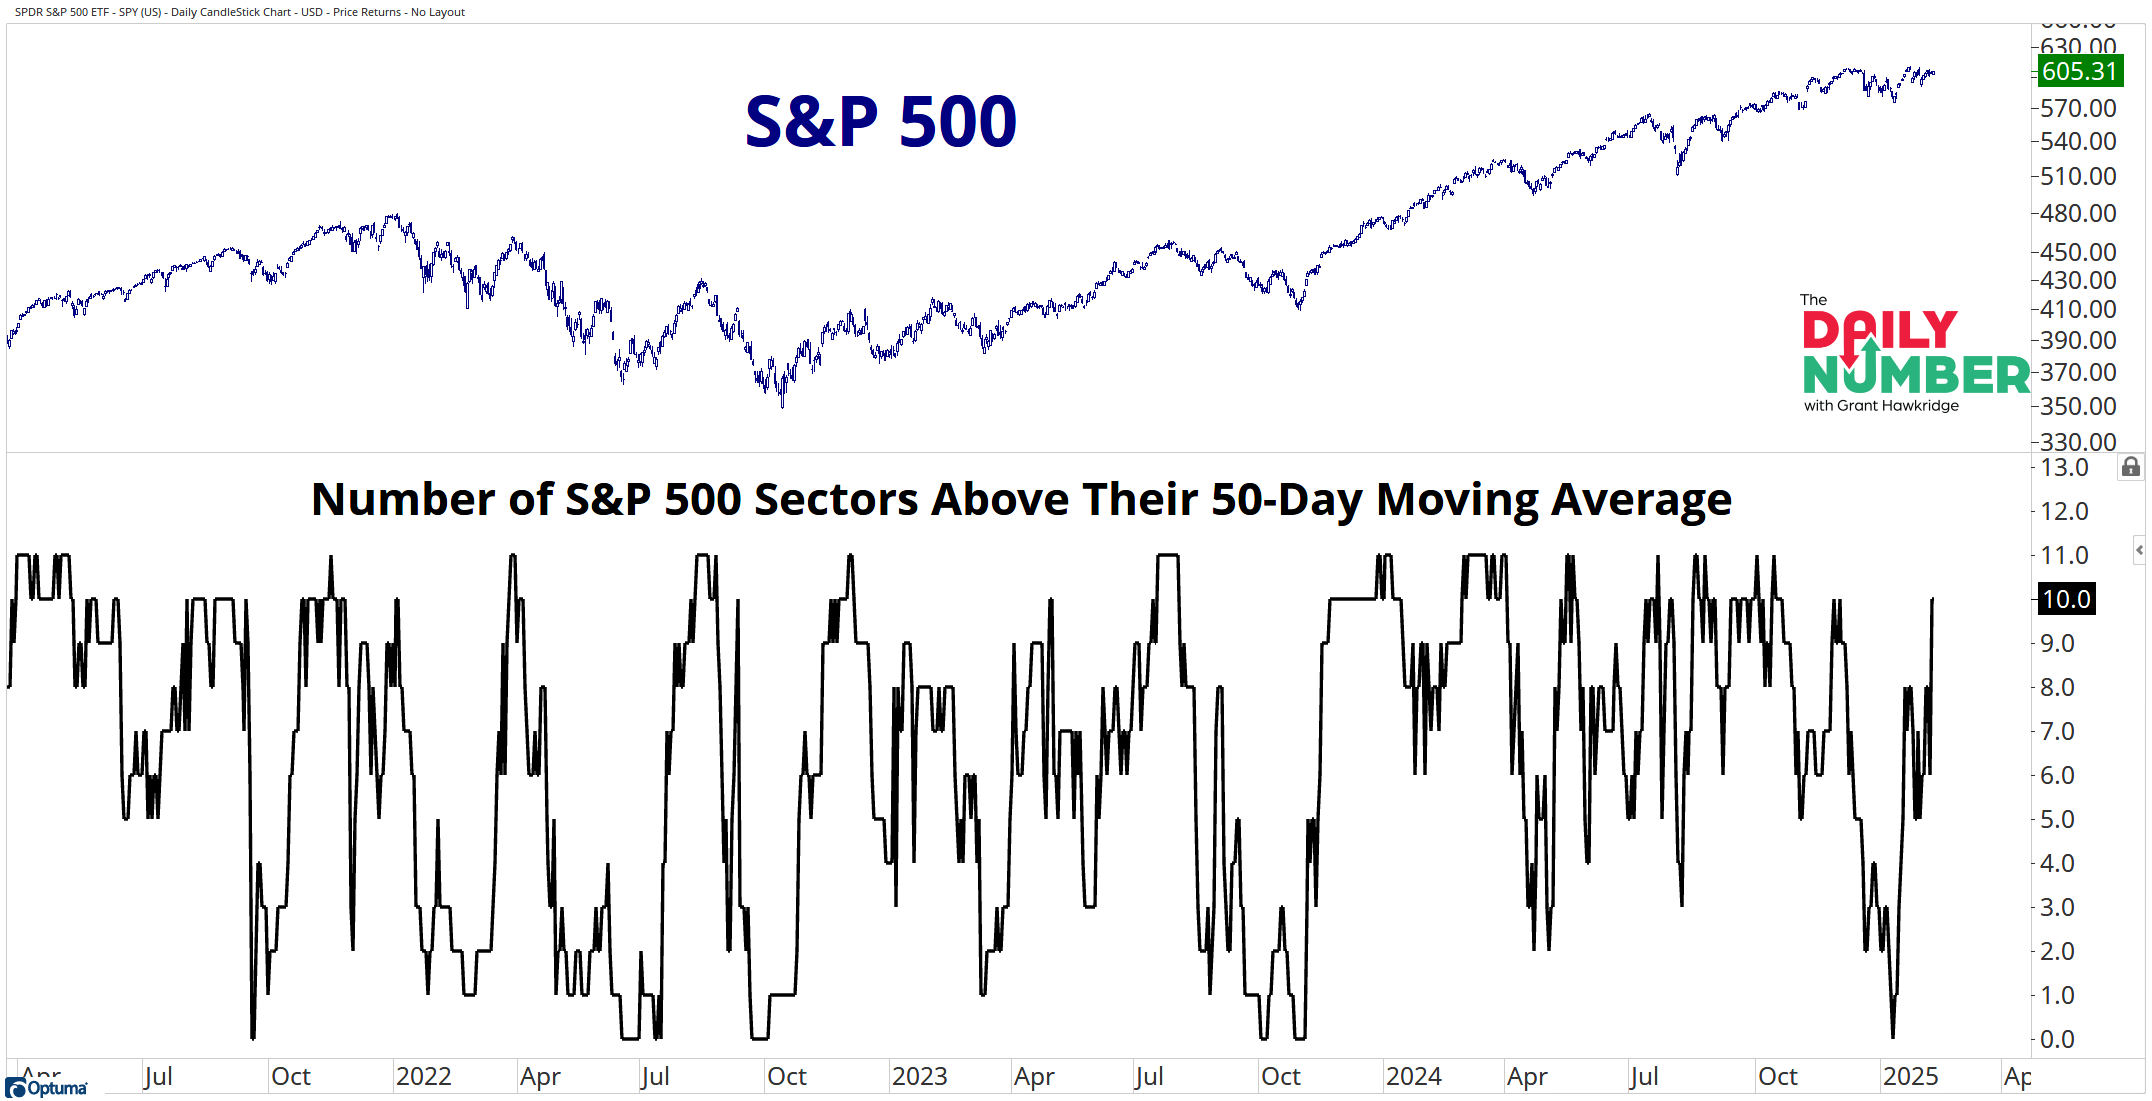
The blue line in the top panel shows the price of the S&P 500 index.
The black line in the bottom panel shows the number of S&P 500 sectors above their 50-day Average.
The Takeaway: In early January of this year, all sectors were below their 50-day moving average. However, over the past 21 trading days, this breadth reading has steadily improved, with 10 out of the 11 sectors now above their 50-day moving averages. This is the highest level we've seen since late November of last year.
The only sector that remains below its 50-day moving average is Consumer Discretionary. This weakness in the Consumer Discretionary sector can be largely attributed to the decline of Tesla, which has recently experienced a sharp drop in price.
The S&P 500 typically does not encounter significant challenges when most sectors are above their 50-day moving averages. The recent increase in this breadth reading indicates underlying strength in the market, which could present opportunities. However, the actual effect on stocks will depend on how long these elevated breadth readings can be sustained, similar to what we saw throughout 2024.
Grant Hawkridge | Chief Aussie Operator, All Star Charts
ICYMI: Steve Strazza did killer session earlier this week breaking down one of the most misunderstood trades in the market right now... China. You can catch the full replay right here
If you find my content valuable, I would greatly appreciate it if you could share it with your friends, family, and colleagues. Your help in spreading the word is invaluable in supporting our work. Thank you to all of you who share!