A Bearish Divergence at Record Highs 🍎 The Chart Report

Chart of the Day
🏆 Today's Chart of the Day was shared by chessNwine.
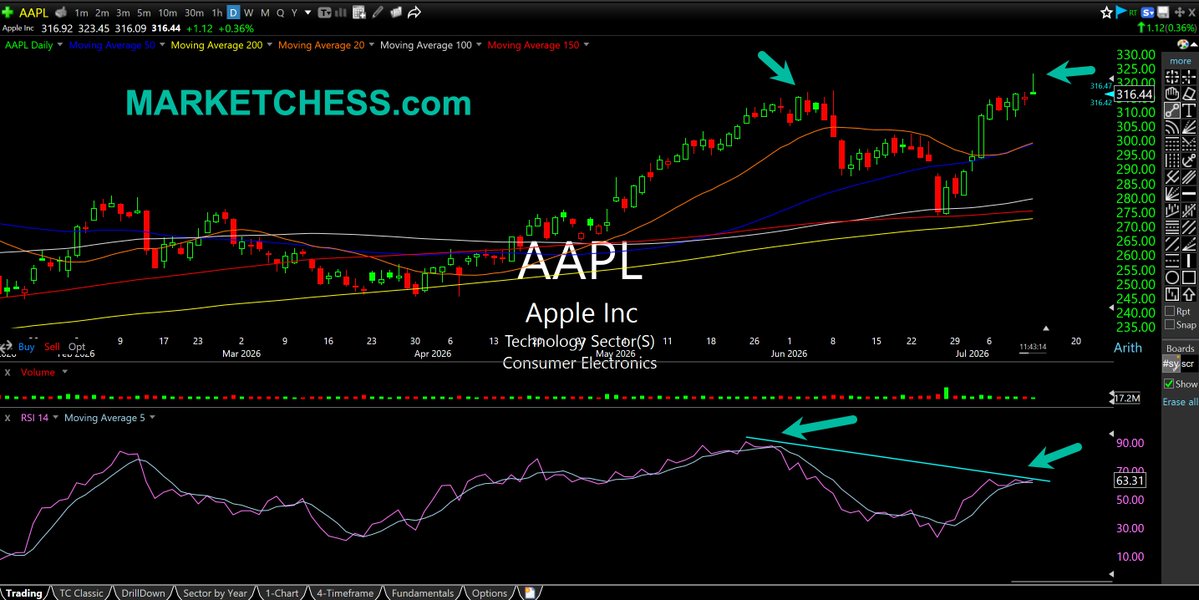
Apple saw an early morning surge of more than 2% before fading throughout the day, though the stock still managed to close at new all-time highs
Momentum has failed to confirm the move, resulting in a bearish momentum (RSI) divergence.
While new highs are bullish, history suggests Apple could face some near-term turbulence, with the stock averaging negative returns one day and one week after making its first all-time high in a month.
The Takeaway: Apple may be due for some short-term weakness after returning to record highs.
More Great Charts
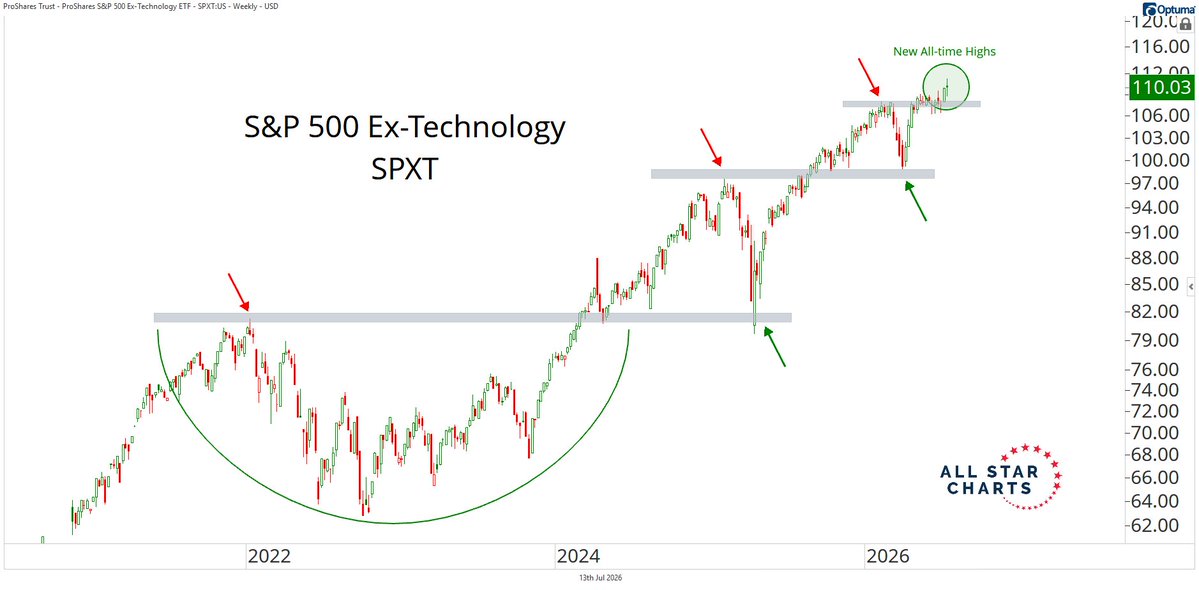
The S&P 500 Ex-Technology ETF closed at new all-time highs last week.
View the whole tweet from Alfonso De Pablos.
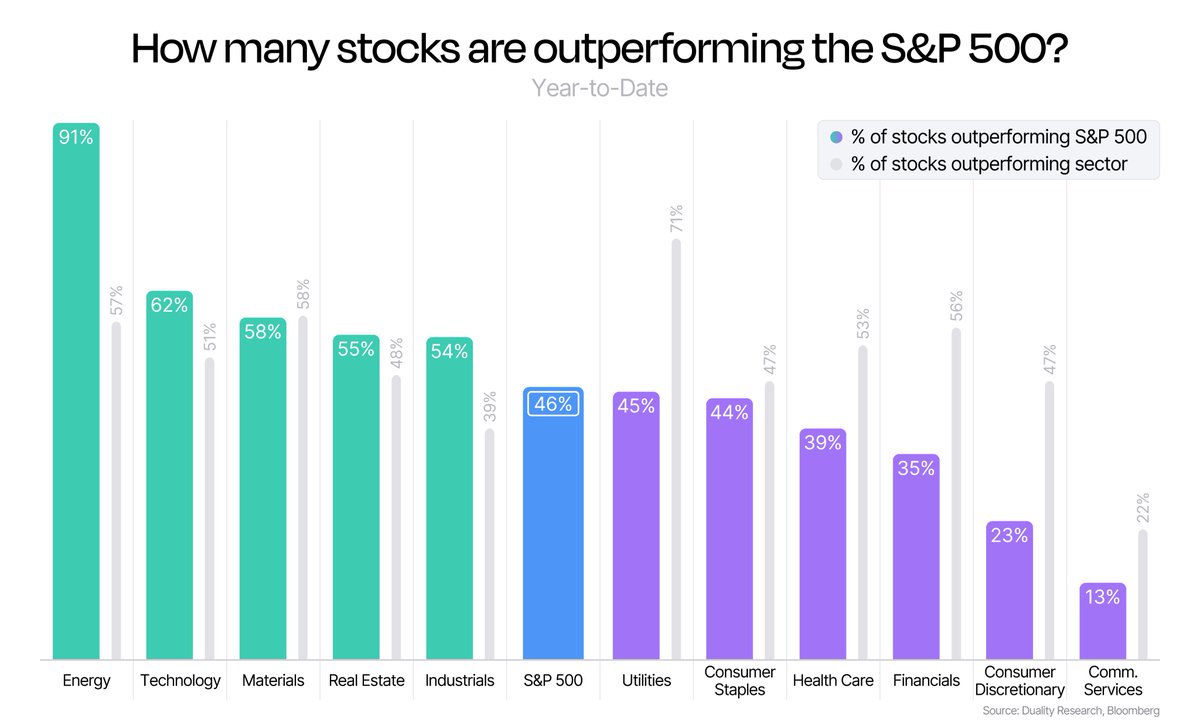
Energy, Technology, and Materials have the highest percentage of stocks outperforming the S&P 500 year-to-date.
Check out the latest article from Duality Research.
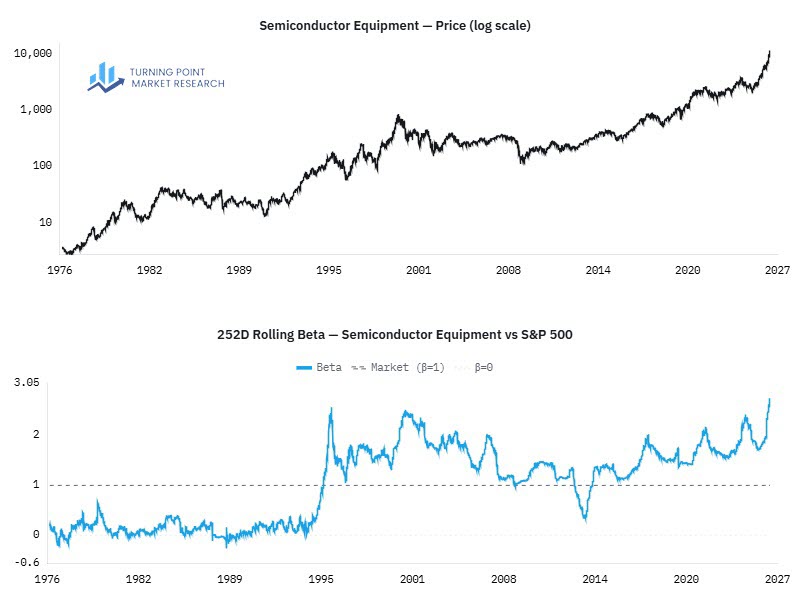
The Semiconductor Equipment industry's 252-day rolling beta has climbed above its dot-com era peak, pushing its volatility relative to the broader market to record levels.
Read the full analysis from Dean Christians.
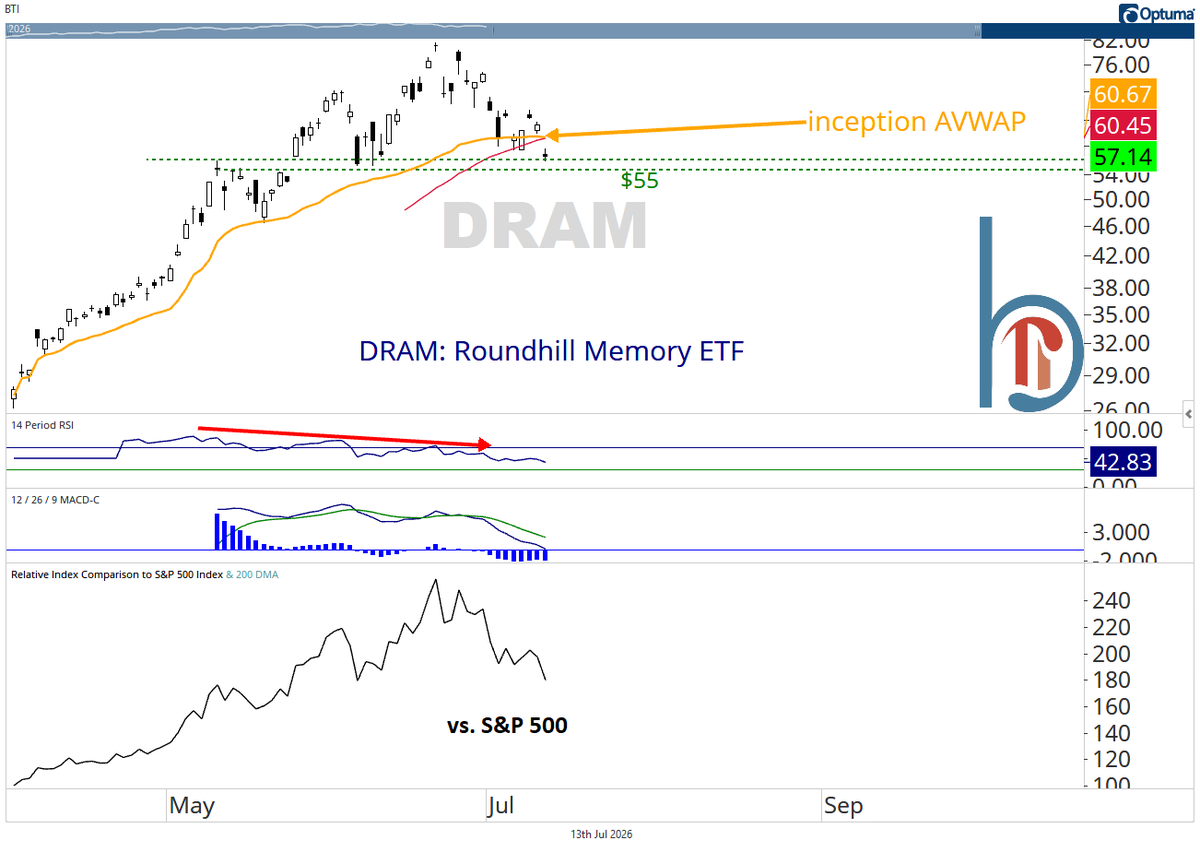
The Memory ETF closed below its inception anchored VWAP for the first time, meaning the average investor in the fund is now sitting on a loss.
See the complete post from Scott Brown.
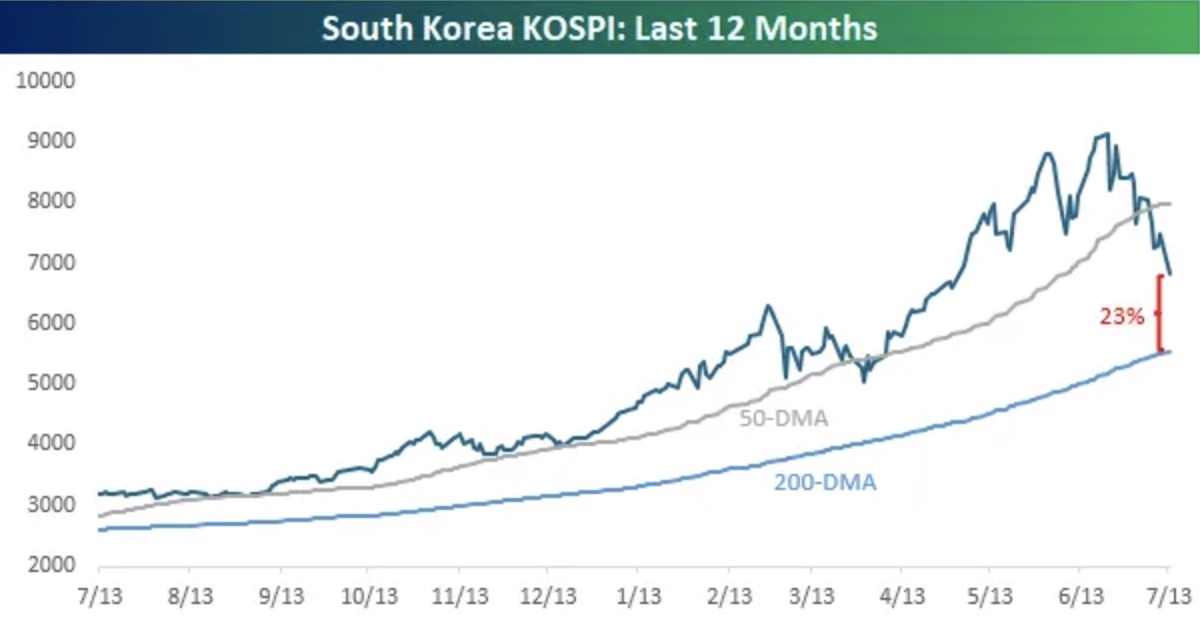
Despite the extreme volatility in the KOSPI, the index still remains 23% above its 200-day moving average.
Explore the entire research note from Bespoke.
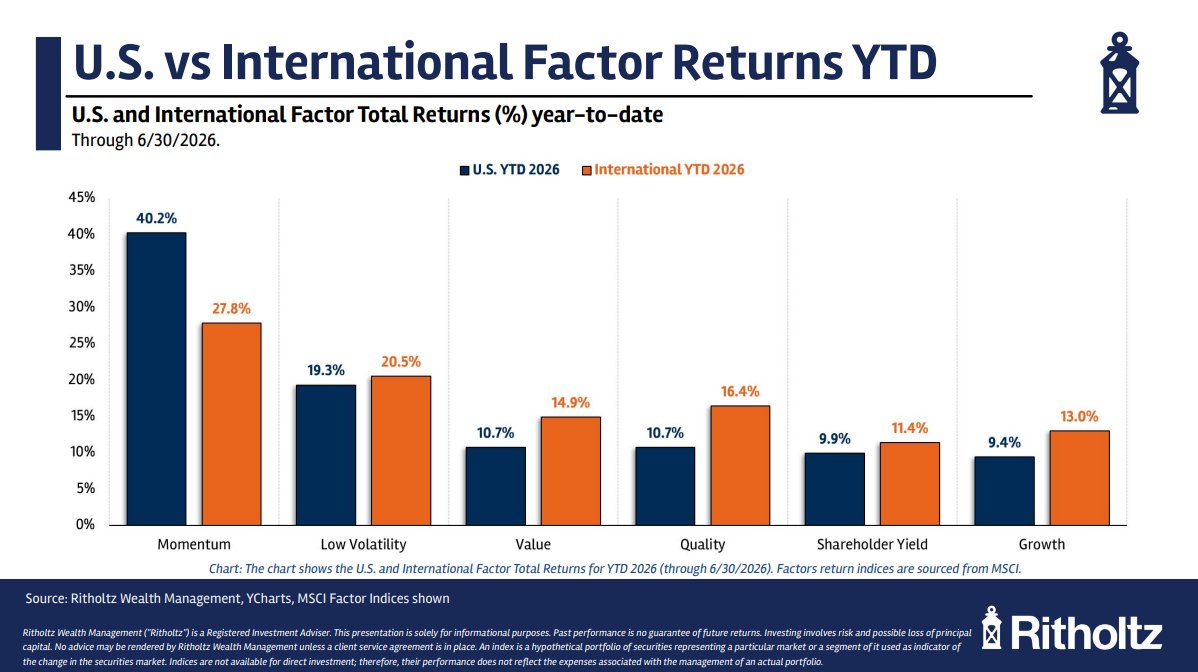
Foreign stocks are outperforming U.S. stocks across every major factor except momentum.
Check out the full article from Ben Carlson.
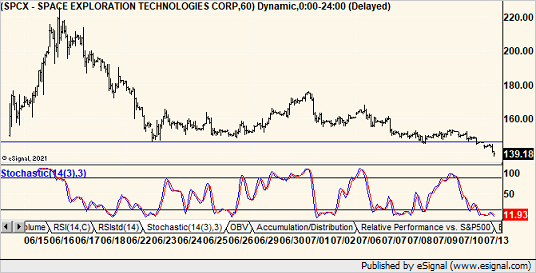
SpaceX has broken below its IPO opening price.
View the whole tweet from Michael Kahn.
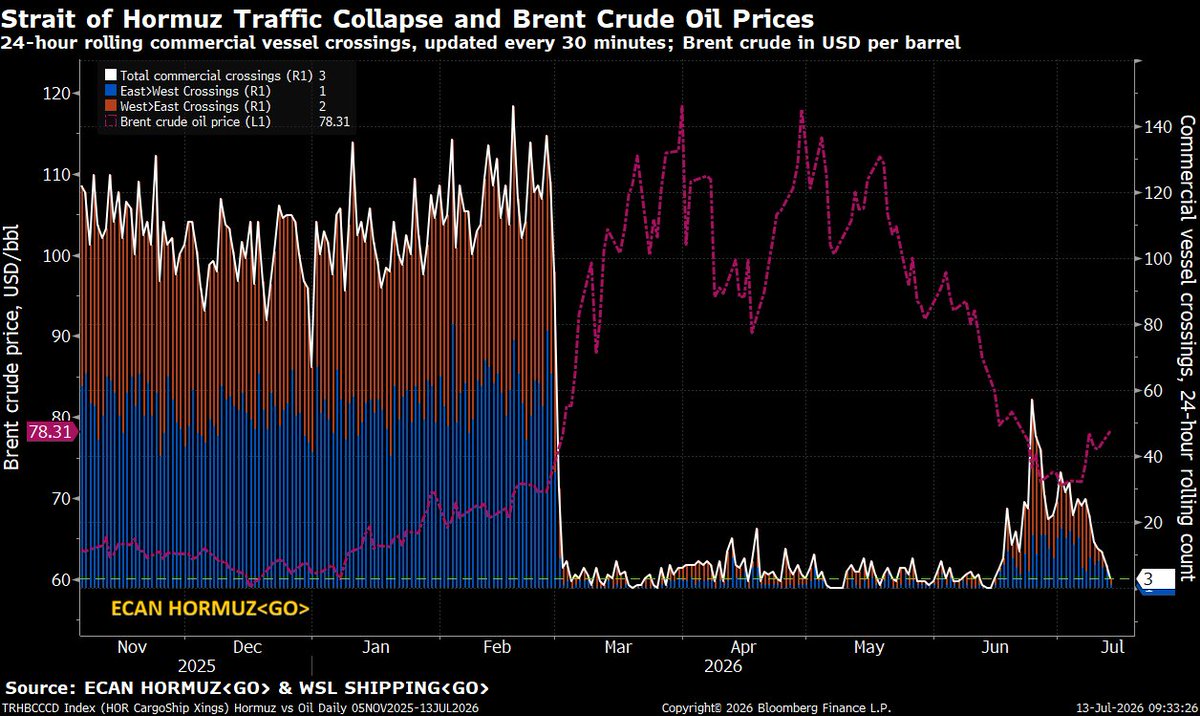
Traffic through the Strait of Hormuz has slowed while crude oil prices have surged higher, highlighting the notable inverse relationship.
See the complete post from Michael McDonough.
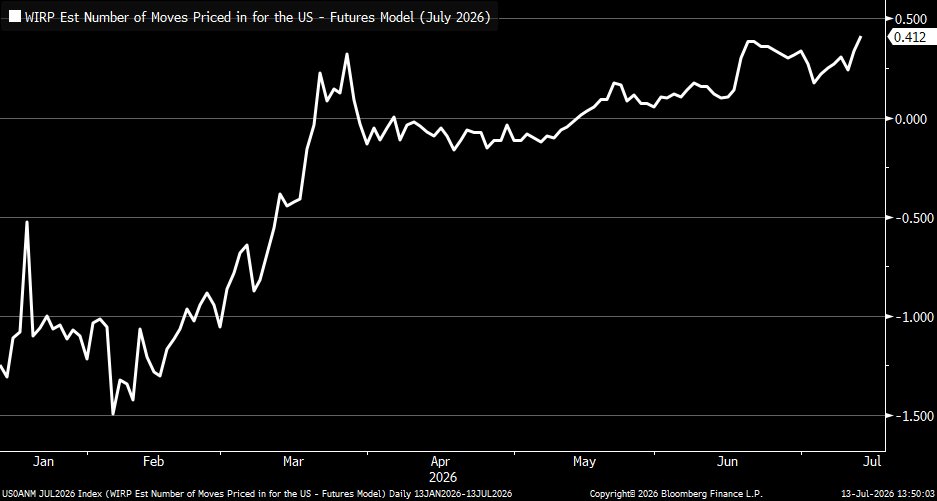
Market expectations for a July Fed rate hike have climbed to new year-to-date highs.
Examine the entire tweet from Kevin Gordon.
The Chart Report curates best-in-class technical analysis from across the web.
If you’d like to share a chart or just say hello, email us at [email protected]